Comparative Study
. 2001 Jun;11(6):981-93.
doi: 10.1101/gr.gr1653r.

Genome evolution at the genus level: comparison of three complete genomes of hyperthermophilic archaea

Affiliations
Comparative Study

Genome evolution at the genus level: comparison of three complete genomes of hyperthermophilic archaea

O Lecompte et al. Genome Res. 2001 Jun.

Abstract

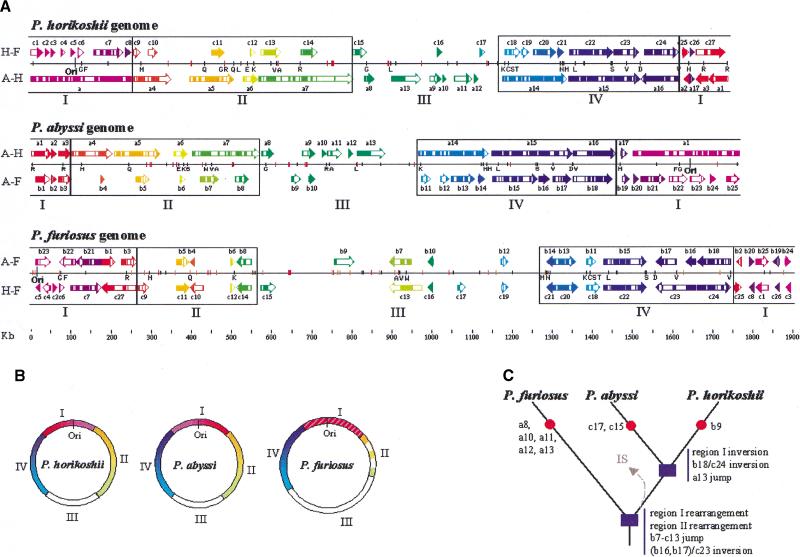
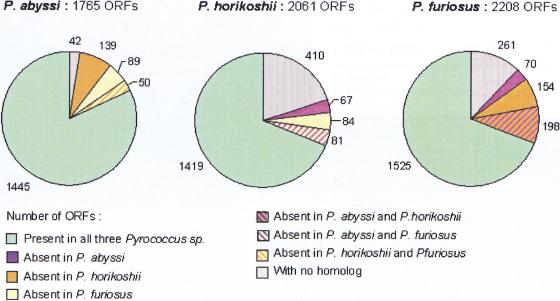
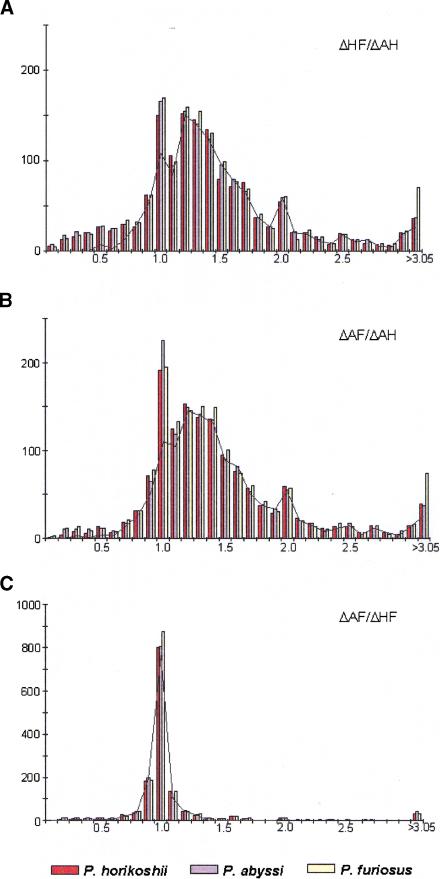
We have compared three complete genomes of closely related hyperthermophilic species of Archaea belonging to the Pyrococcus genus: Pyrococcus abyssi, Pyrococcus horikoshii, and Pyrococcus furiosus. At the genomic level, the comparison reveals a differential conservation among four regions of the Pyrococcus chromosomes correlated with the location of genetic elements mediating DNA reorganization. This discloses the relative contribution of the major mechanisms that promote genomic plasticity in these Archaea, namely rearrangements linked to the replication terminus, insertion sequence-mediated recombinations, and DNA integration within tRNA genes. The combination of these mechanisms leads to a high level of genomic plasticity in these hyperthermophilic Archaea, at least comparable to the plasticity observed between closely related bacteria. At the proteomic level, the comparison of the three Pyrococcus species sheds light on specific selection pressures acting both on their coding capacities and evolutionary rates. Indeed, thanks to two independent methods, the "reciprocal best hits" approach and a new distance ratio analysis, we detect the false orthology relationships within the Pyrococcus lineage. This reveals a high amount of differential gains and losses of genes since the divergence of the three closely related species. The resulting polymorphism is probably linked to an adaptation of these free-living organisms to differential environmental constraints. As a corollary, we delineate the set of orthologous genes shared by the three species, that is, the genes that may characterize the Pyrococcus genus. In this conserved core, the amino acid substitution rate is equal between P. abyssi and P. horikoshii for most of their shared proteins, even for fast-evolving ones. In contrast, strong discrepancies exist among the substitution rates observed in P. furiosus relative to the two other species, which is in disagreement with the molecular clock hypothesis.


Figures

Figure 1
Figure 1
Comparison of the chromosomal organization of the three Pyrococcus genomes. (A) Each genome is represented by three lines. The medium horizontal black line symbolizes the genome. A black vertical line represents the replication origin (Ori). The black vertical ticks indicate the positions of the tRNA genes; orange and red vertical ticks represent the insertion sequences, and the genes encoding the Pyrococcus-specific ATP-binding proteins, respectively. The upper and lower lines of colored arrows illustrate the oppositions of colinear segments between the considered genome and each of the other two genomes as obtained by three pairwise nucleotide comparisons (see Methods). A-H is the comparison between P. abyssi and P. horikoshii (arrows labeled from a1 to a17). A-F is the comparison between P. abyssi and P. furiosus (labeled from b1 to b25). H-F is the comparison between P. horikoshii and P. furiosus (labeled from c1 to c27). The arrows have been labeled arbitrarily, oriented, and colored according to the P. abyssi genome (arrows a1–a17 and arrows b1–b25), and the P. horikoshii genome (arrows c1–c27). For representation convenience, only segments >10 kb are plotted. White boxes inside arrows specify indel areas >2 kb. The P. abyssi genome has been reverse complemented to facilitate the analysis. Only the tRNAs located at the boundaries (2 kb resolution) of colinear segments or indels areas are labeled according to the amino acid one-letter code. The regions of differential conservation (I, II, III, and IV) are delimitated by black boxes. The scale is indicated at the bottom of the figure. (B) Circular representation of the three chromosomes showing the four regions (I, II, III, and IV) according to the colors defined above and the origin of replication Ori. (C) Schematic diagram of the phylogenetic relationships among the three Pyrococcus species. Red circles illustrate the absence of segments (named on the side) in one of the three species. Blue boxes represent major events that occurred within Pyrococcus lineage (see text). The arrow labeled IS symbolizes the putative loss of IS in the common ancestor of P. abyssi and P. horikoshii.
Figure 2
Figure 2
Homology relationship distribution within the Pyrococcus genus. The figure shows, for each species, the fractions of genes common to the three Pyrococcus, shared by two Pyrococcus, unique to one Pyrococcus, and with no homolog in the current databases.
Figure 3
Figure 3
Distance ratios within trios of homologous genes from the three Pyrococcus species. The figures represent the distributions of (A) ΔHF/ΔAH ratios, (B) ΔAF/ΔAH ratios, and (C) ΔAF/ΔHF ratios. Intervals include the upper bound ([0.45, 0.55] for instance), and the last interval of the distributions embrace all values >3.05. Histograms show distance ratio distributions for all trios of homologous genes and calculated independently in each species: P. horikoshii in red, P. abyssi in blue, and P. furiosus in yellow. The black curves represent the distance ratio distributions of the minimal calculated set of true orthologs common to the three species. Abbreviations are ΔAF for distance between P. abyssi and P. furiosus homologs, ΔAH for distance between P. abyssi and P. horikoshii homologs, and ΔHF for distance between P. horikoshii and P. furiosus homologs.

Similar articles

Cited by

References

    1. Akashi H. Molecular evolution between Drosophila melanogaster and D. simulans: Reduced codon bias, faster rates of amino acid substitution, and larger proteins in D. melanogaster. Genetics. 1996;144:1297–1307. - PMC - PubMed
    1. Alm RA, Ling LS, Moir DT, King BL, Brown ED, Doig PC, Smith DR, Noonan B, Guild BC, de Jonge BL, et al. Genomic-sequence comparison of two unrelated isolates of the human gastric pathogen Helicobacter pylori. Nature. 1999;397:176–180. - PubMed
    1. Altschul SF, Madden TL, Schaffer AA, Zhang J, Zhang Z, Miller W, Lipman DJ. Gapped BLAST and PSI-BLAST: A new generation of protein database search programs. Nucleic Acids Res. 1997;25:3389–3402. - PMC - PubMed
    1. Andersson JO, Andersson SG. Insights into the evolutionary process of genome degradation. Curr Opin Genet Dev. 1999;9:664–671. - PubMed
    1. Aravind L, Tatusov RL, Wolf YI, Walker DR, Koonin EV. Evidence for massive gene exchange between archaeal and bacterial hyperthermophiles. Trends Genet. 1998;14:442–444. - PubMed

Publication types

Associated data