Comparative Study
. 2001 Jun;11(6):1034-42.
doi: 10.1101/gr.gr1743r.

Comprehensive genome sequence analysis of a breast cancer amplicon

Affiliations
Comparative Study

Comprehensive genome sequence analysis of a breast cancer amplicon

C Collins et al. Genome Res. 2001 Jun.

Abstract

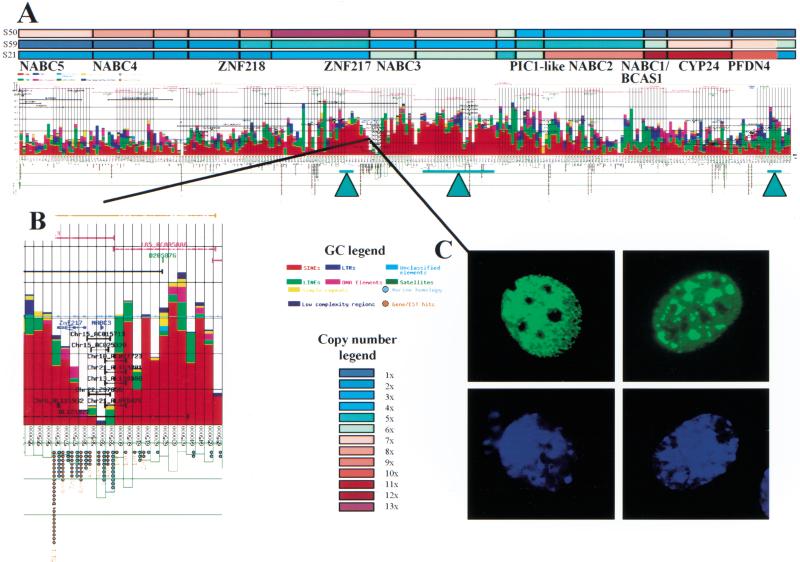
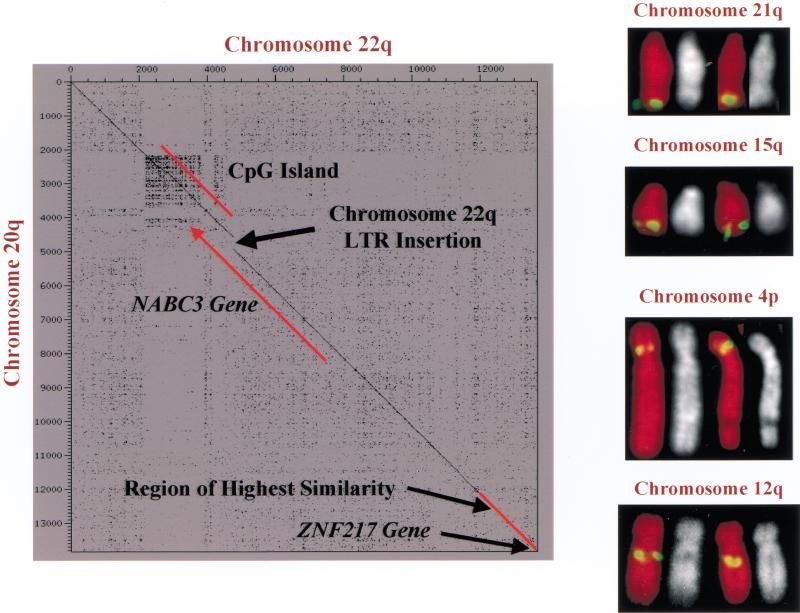
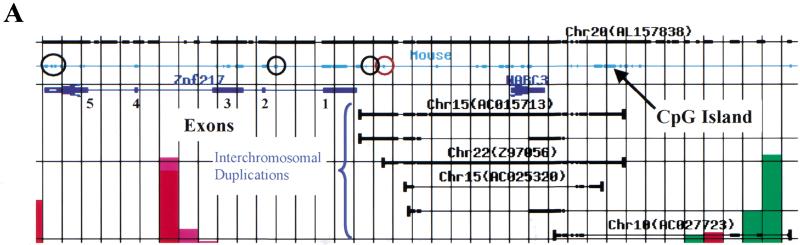
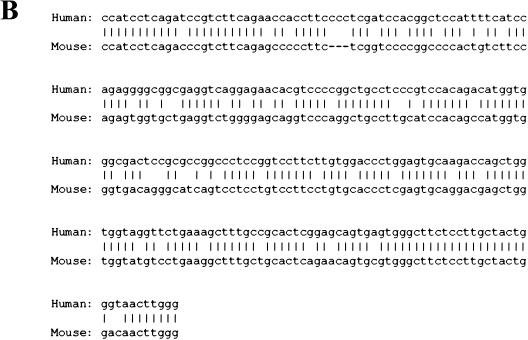
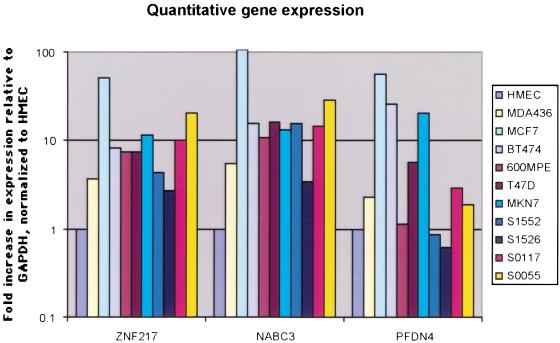
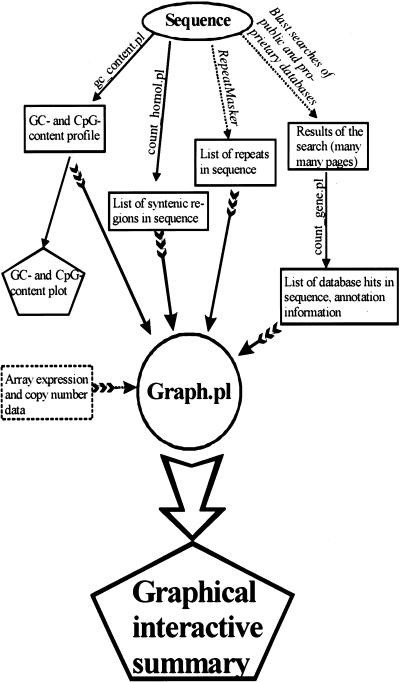
Gene amplification occurs in most solid tumors and is associated with poor prognosis. Amplification of 20q13.2 is common to several tumor types including breast cancer. The 1 Mb of sequence spanning the 20q13.2 breast cancer amplicon is one of the most exhaustively studied segments of the human genome. These studies have included amplicon mapping by comparative genomic hybridization (CGH), fluorescent in-situ hybridization (FISH), array-CGH, quantitative microsatellite analysis (QUMA), and functional genomic studies. Together these studies revealed a complex amplicon structure suggesting the presence of at least two driver genes in some tumors. One of these, ZNF217, is capable of immortalizing human mammary epithelial cells (HMEC) when overexpressed. In addition, we now report the sequencing of this region in human and mouse, and on quantitative expression studies in tumors. Amplicon localization now is straightforward and the availability of human and mouse genomic sequence facilitates their functional analysis. However, comprehensive annotation of megabase-scale regions requires integration of vast amounts of information. We present a system for integrative analysis and demonstrate its utility on 1.2 Mb of sequence spanning the 20q13.2 breast cancer amplicon and 865 kb of syntenic murine sequence. We integrate tumor genome copy number measurements with exhaustive genome landscape mapping, showing that amplicon boundaries are associated with maxima in repetitive element density and a region of evolutionary instability. This integration of comprehensive sequence annotation, quantitative expression analysis, and tumor amplicon boundaries provide evidence for an additional driver gene prefoldin 4 (PFDN4), coregulated genes, conserved noncoding regions, and associate repetitive elements with regions of genomic instability at this locus.


Figures

Figure 1
Figure 1
Integration of genome copy number and genome sequence information in a region of amplification at 20q13.2. (A) Genome Cryptographer (GC) analysis of a 1.2-Mb region of amplification. Average genome copy number values in selected tumors (S50, S59, S21) measured using array Comparative Genomic Hybridization (CGH) (Albertson et al. 2000) are shown as color-coded bars at the top of the figure. The array CGH data were obtained using a contig of BAC clones that now have been sequenced. Brick red lines represent public draft assemblies as of 2.1.01. Pink lines correspond to the exact size and position of the BAC clones used in the study. Densities and classification of repetitive elements are shown in color-coded cumulative bar chart above the X axis. CpG dinucleotide densities are plotted below the X axis as open green boxes. Sequence features such as genes are shown as horizontal lines above the X axis spanning the total extent of the sequence similarity. Exons are shown in bold lines. Genes and pseudogenes are represented by blue arrows pointing in the direction of transcription. The names of genes appear below the CGH copy number plot in black bold font. Total number of gene/EST hits and/or mouse identity regions are presented below the X axis as red or blue circles, respectively. Aquamarine triangles with bars, indicating the mapping resolution, mark the approximate positions of amplicon boundaries mapped by array CGH (Albertson et al. 2000), fluorescent in-situ hybridization (FISH) (Collins et al. 1998) and Southern hybridization (Collins et al., unpubl.). This figure can also be viewed at http://shark.ucsf.edu:8080/∼stas/GR2001/index.html. (B) Enlargement of the ZNF217-NABC3 region of 20q13.2 amplification. This panel further illustrates the ability of GC to annotate features such as public draft sequence assembly (orange), BAC template locations (pink), STSs (dark green), alignment of syntenic murine sequence (light blue line), human/murine sequence identities (light blue rectangle on line), human genes (dark blue), duplications and other identities to human genomic sequence (black). The locations of genome duplications (e.g., Chr15_AC015713) are identified above the black line indicating the chromosome 20 location of each duplicon. Ratios shown beneath EST clusters correspond to the total number of EST hits/total murine EST hits. Numbers under blue circles indicate the total number of murine sequence identities per analysis interval. (C) ZNF217-EGFP fusion proteins localize to the nucleus of HeLa cells and are excluded from the nucleoli. The top two panels show localization of ZNF217-GFP fusion and the bottom two panels show DAPI staining of cell nuclei.
Figure 2
Figure 2
Dotter (http://www.cgr.ki.se/cgr/groups/sonnhammer/Dotter.html) analysis of 14 kb 20q:22q duplication showing very high primary structure conservation. This plot corresponds to coordinates ∼580,000–594,000 in (B) and is an alignment between Chr22_Z97056 and sequence at 20q13.2. The positions of a CpG island, the NABC3 gene interrupted by insertion of a LTR on chromosome 22, and the start of the ZNF217 gene are annotated. Results of fluorescence in situ hybridization (FISH) mapping of four bacterial artificial chromosome (BAC) clones isolated by screening the Caltech D human BAC library with duplicon-specific probes. The FISH mapping confirms chromosome duplications shown in Figures 1A, 1C, 3A, and in this figure.
Figure 3
Figure 3
(A) A high-resolution Genome Cryptographer (GC) analysis showing human/mouse sequence alignment. GC analysis was carried out in an analysis interval of 1 kb. This figure shows a chromosome 20 PAC (AL157838) in black. The extent of syntenic mouse sequence is indicated by a thin blue line with sequence identities shown as heavy lines. Human genes ZNF217 and NABC3 appear as dark blue arrows pointing in the direction of transcription. Bracketed lines show interchromosomal duplications. Their extent is shown as thin black lines with actual sequence identities indicated by heavy black lines (e.g., Chr15, AC015713). (B) Sequence alignment of noncoding conserved human and mouse sequence (circled in red on the GC analysis in A).
Figure 3
Figure 3
(A) A high-resolution Genome Cryptographer (GC) analysis showing human/mouse sequence alignment. GC analysis was carried out in an analysis interval of 1 kb. This figure shows a chromosome 20 PAC (AL157838) in black. The extent of syntenic mouse sequence is indicated by a thin blue line with sequence identities shown as heavy lines. Human genes ZNF217 and NABC3 appear as dark blue arrows pointing in the direction of transcription. Bracketed lines show interchromosomal duplications. Their extent is shown as thin black lines with actual sequence identities indicated by heavy black lines (e.g., Chr15, AC015713). (B) Sequence alignment of noncoding conserved human and mouse sequence (circled in red on the GC analysis in A).
Figure 4
Figure 4
RNA expression levels of ZNF217, NABC3, and PFDN4 in six cell lines and four mammary tumors. Transcript levels are calculated as 2 -ΔN (Albertson et al. 2000) with GAPDH as a reference gene and relative to the expression levels as measured in the human mammary epithelial cells (HMECs). As a control, expression levels were measured with GUS as a reference gene, which also showed nearly identical expression profiles for ZNF217 and NABC3 (not shown). Cultured HMECs, cell lines MCF7, MDA436, BT474, 600MPE, T47D, and MKN7, primary tumors S1552, S1526, S0117, and S0055 were used as a source of template mRNA for this experiment.
Figure 5
Figure 5
Genome Cryptographer (GC) flowchart. The names of programs are given above solid arrows lacking feathers. Programs from the public domain are shown in italics. The final graphics output is presented in pentagrams. Intermediate data are shown in rectangles. Input of information into the graphics module (graph.pl) is shown by feathered arrows. A module for integrating expression and copy number array data is under development. GC and GC tutorial are available at http://kinase.ucsf.edu/gc.

Similar articles

Cited by

References

    1. Albertson DG, Ylstra B, Segraves R, Collins C, Dairkee SH, Kowbel D, Kuo WL, Gray JW, Pinkel D. Quantitative mapping of amplicon structure by array CGH identifies CYP24 as a candidate oncogene. Nat Genet. 2000;25:144–146. - PubMed
    1. Beckman MJ, DeLuca HF. Assay of 25-hydroxyvitamin D 1 alpha-hydroxylase and 24-hydroxylase. Methods Enzymol. 1997;282:200–213. - PubMed
    1. Brosius J. RNAs from all categories generate retrosequences that may be exapted as novel genes or regulatory elements. Gene. 1999;238:115–134. - PubMed
    1. Christian SL, Fantes JA, Mewborn SK, Huang B, Ledbetter DH. Large genomic duplicons map to sites of instability in the Prader- Willi/Angelman syndrome chromosome region (15q11-q13) Hum Mol Genet. 1999;8:1025–1037. - PubMed
    1. Collins C, Rommens JM, Kowbel D, Godfrey T, Tanner M, Hwang SI, Polikoff D, Nonet G, Cochran J, Myambo K, et al. Positional cloning of ZNF217 and NABC1: Genes amplified at 20q13.2 and overexpressed in breast carcinoma. Proc Natl Acad Sci. 1998;95:8703–8708. - PMC - PubMed

Publication types