. 2001 May 28;153(5):1097-110.
doi: 10.1083/jcb.153.5.1097.

Nucleolar assembly of the rRNA processing machinery in living cells

Affiliations

Nucleolar assembly of the rRNA processing machinery in living cells

T M Savino et al. J Cell Biol. .

Abstract

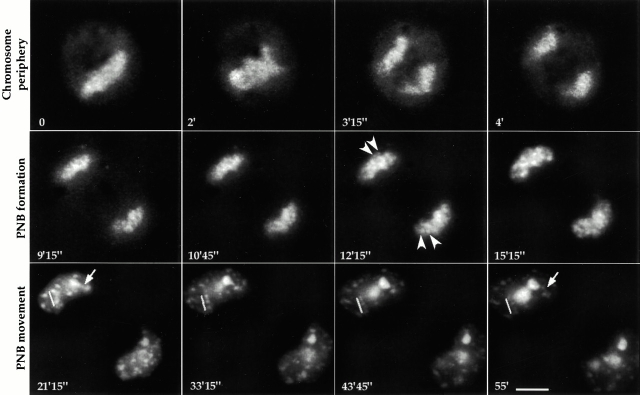
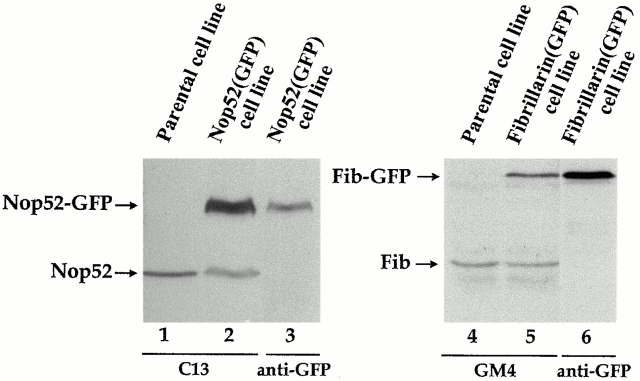
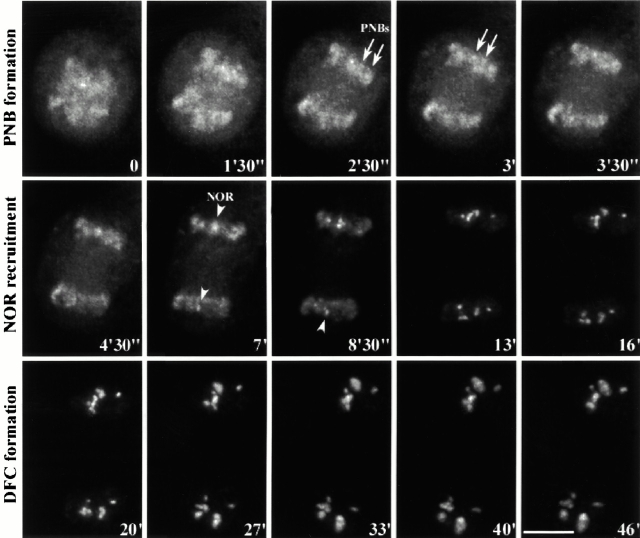
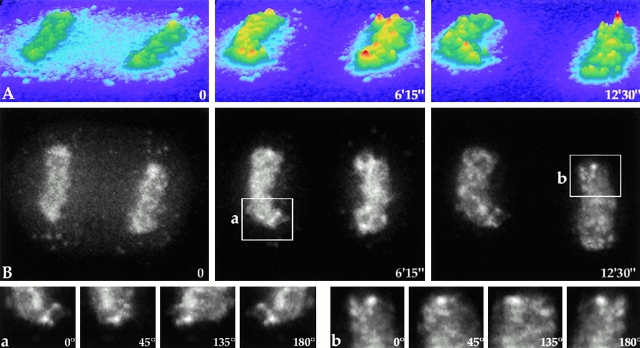
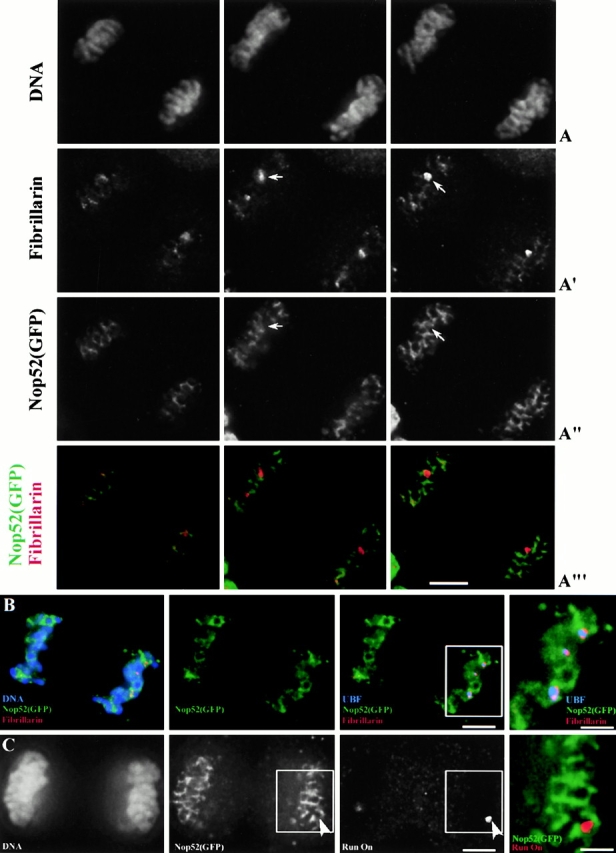
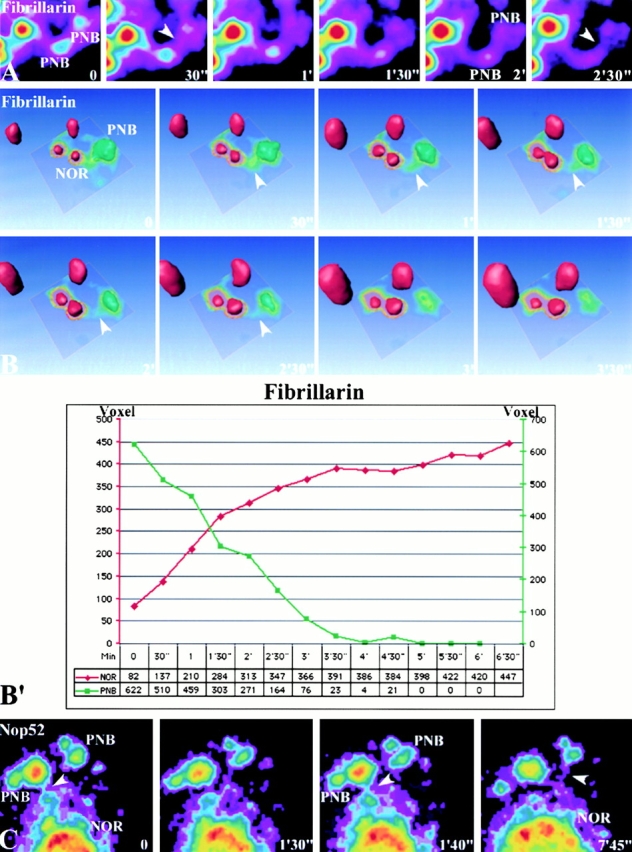
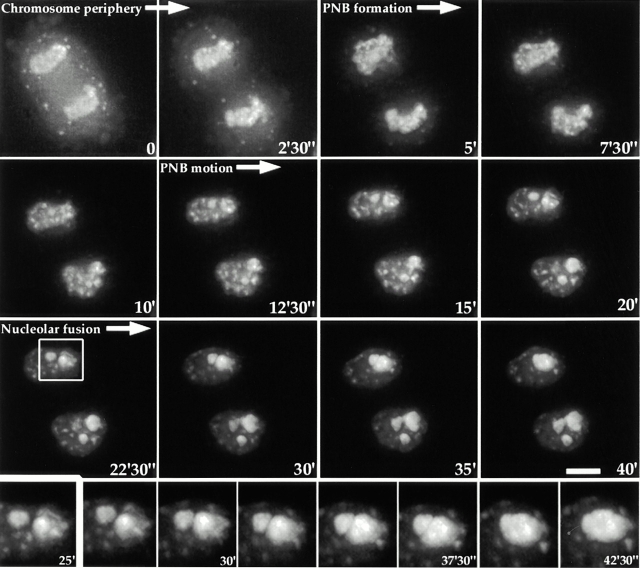
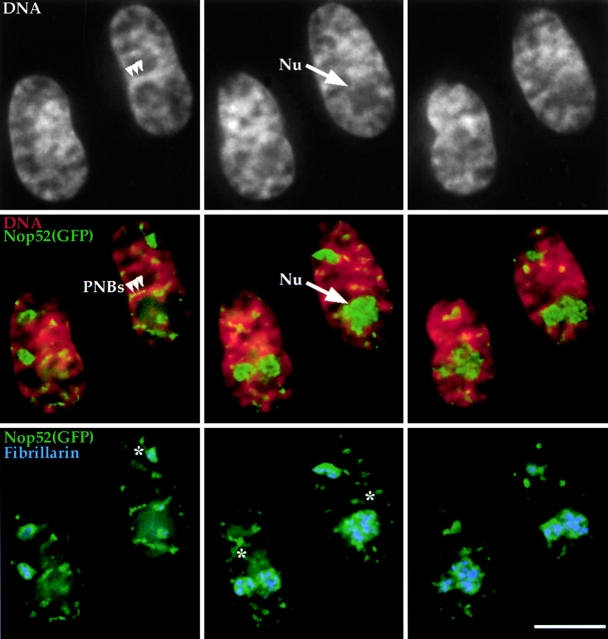
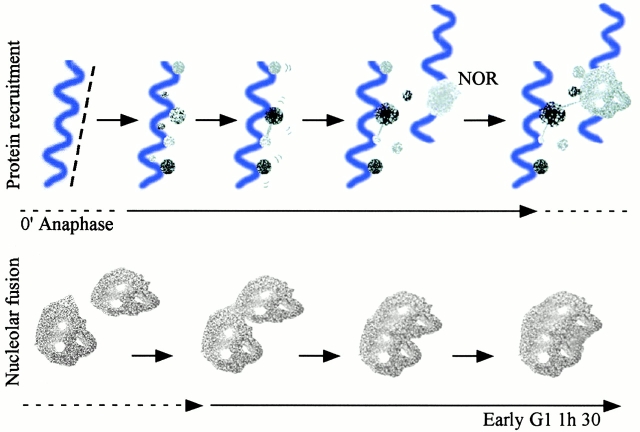
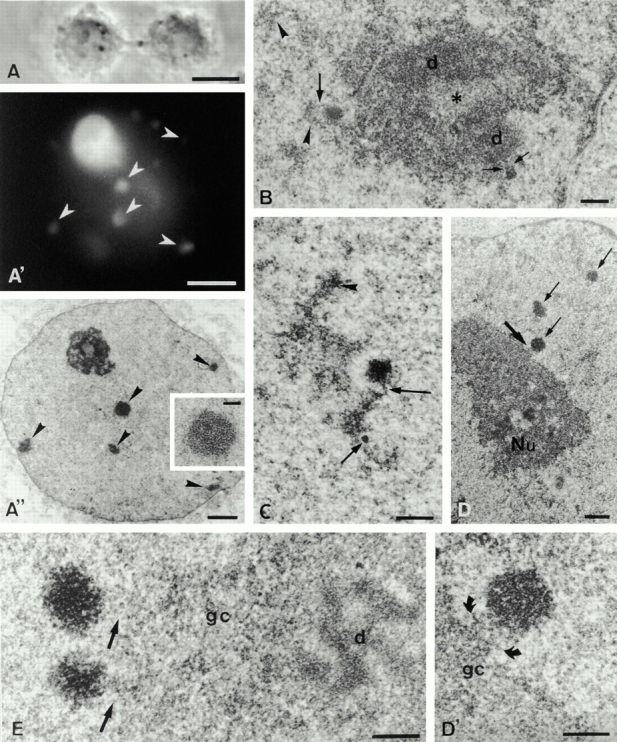
To understand how nuclear machineries are targeted to accurate locations during nuclear assembly, we investigated the pathway of the ribosomal RNA (rRNA) processing machinery towards ribosomal genes (nucleolar organizer regions [NORs]) at exit of mitosis. To follow in living cells two permanently transfected green fluorescence protein-tagged nucleolar proteins, fibrillarin and Nop52, from metaphase to G1, 4-D time-lapse microscopy was used. In early telophase, fibrillarin is concentrated simultaneously in prenucleolar bodies (PNBs) and NORs, whereas PNB-containing Nop52 forms later. These distinct PNBs assemble at the chromosome surface. Analysis of PNB movement does not reveal the migration of PNBs towards the nucleolus, but rather a directional flow between PNBs and between PNBs and the nucleolus, ensuring progressive delivery of proteins into nucleoli. This delivery appeared organized in morphologically distinct structures visible by electron microscopy, suggesting transfer of large complexes. We propose that the temporal order of PNB assembly and disassembly controls nucleolar delivery of these proteins, and that accumulation of processing complexes in the nucleolus is driven by pre-rRNA concentration. Initial nucleolar formation around competent NORs appears to be followed by regroupment of the NORs into a single nucleolus 1 h later to complete the nucleolar assembly. This demonstrates the formation of one functional domain by cooperative interactions between different chromosome territories.


Figures

Figure 2
Figure 2
Time-lapse sequence of Nop52-GFP, from mitosis to early G1 phase. Projection of 15 focal planes. Nop52-GFP is found at the periphery of the chromosomes during metaphase (time 0). It follows chromosome movement reaching the poles after 4 min. Between 10 to 15 min, Nop52-GFP is redistributed and concentrates in PNBs (arrowheads). PNBs either display an oscillatory movement in the nucleoplasm, deliver material to incipient nucleoli, or disintegrate on the spot. See also Video 1. 1 h after the beginning of anaphase, Nop52-containing PNBs are still observed. PNB alignments in the nucleoplasm (white lines) and protein flow in the vicinity of nucleoli (arrows) are observed. Bar, 10 μm. See video for nucleolar reconstruction.
Figure 1
Figure 1
SDS-Page analysis of whole cell lysates of stably transfected and nontransfected HeLa cells. The same number of nontransfected parental cells and Nop52-GFP transfected cells were probed with C13. In lane 1, endogenous Nop52 is detected as a single band of 52 kD. Two bands of 52 and 80 kD were detected in lane 2, Nop52 and Nop52-GFP, respectively. When the blot of lane 2 was probed with anti-GFP, only Nop52-GFP was detected, lane 3. The same number of nontransfected parental cells and fibrillarin (Fib)-GFP transfected cells were probed with GM4 (antifibrillarin antibody). In lane 4, only a 34-kD band corresponding to fibrillarin was detected; in stable fibrillarin-GFP cells, lane 5, two bands of 34 and 65 kD were seen, fibrillarin and fibrillarin-GFP, respectively. When the blot of lane 5 was probed with anti-GFP, only the band corresponding to fibrillarin-GFP was revealed, lane 6.
Figure 3
Figure 3
Time-lapse sequence of fibrillarin-GFP, from mitosis to early G1 phase. Projection of 33 focal planes. At 2′30″, fibrillarin starts to assemble in PNBs (arrows). NORs become very distinct at 7 min (arrowheads). In <15 min incipient nucleoli can be seen. Then, the DFC-containing fibrillarin expands progressively (from 20 min). See also Video 2. Note that in this figure, the illustration starts after the onset of anaphase. Time 0 corresponds approximately to 2′30″ after metaphase as evidenced in Video 3. Bar, 10 μm. See also Video 7 (online supplement) for nucleolar reconstruction.
Figure 4
Figure 4
Localization of Nop52 during telophase in time-lapse sequences. Projection of 25 focal planes. Three key steps can be observed, the periphery of the chromosomes (time 0), PNB formation (6′15″), and the recruitment of Nop52 in the NORs (12′30″). These steps are represented by an intensity profile (A) in color and height, low intensity signal in pale blue, and high intensity represented in red by peaks. (B) The same image as in panel A is shown as a two-dimensional projection. Nop52 is found at the periphery of the chromosomes, and in a 3-D image (enlargement of squares a and b) a network is observed, distributed in the interchromatin space, structures become discrete, and protein distributes in foci or PNBs. A projection of different angles is presented in a and b. See also Video 4, A and B, for 4-D PNB formation.
Figure 5
Figure 5
Relative distribution of Nop52 and fibrillarin in fixed cells in telophase. (A–A′′′) 55 focal planes of 0.2 μm of a fixed cell were recorded. Three focal planes are shown, the condensed chromatin is visualized (A) by DAPI, and fibrillarin is mostly accumulated in NORs (arrows) and to a lesser extent at the chromosome periphery (A′). However, Nop52-GFP remains underlining the chromosome periphery and accumulates in small foci that do not localize at NORs (A′′′); see merge (A′′′). See also Video 5. (B) Detection on a single optical section of UBF, fibrillarin, Nop52, and DNA. In merge, UBF colocalizes partially with fibrillarin at NORs whereas Nop52 is distributed at the chromosome periphery; see enlargement of the merge. (C) Detection by run on of RNA pol I transcription on a single optical section. RNA pol I transcription (arrowhead) is already active whereas Nop52 is still distributed at the periphery of condensed chromosomes; see enlargement of the signals visible in the square in the merged image. For 3-D cell reconstruction of panel A, see corresponding video. Bars, 10 μm and 5 μm in enlargements of B and C.
Figure 6
Figure 6
Protein delivery from PNBs to NORs/nucleoli and between PNBs. The delivery of material from PNBs to NORs is performed by flow (arrowheads); these flows do not last more than 2 min. This was observed for fibrillarin and Nop52 (A–C). (B) To better show the flow between PNB and NOR and quantify the volumes of these structures, we applied a surface rendering using Amira software (TGS). One of the two PNBs shown in panel A is selected and its interaction with the adjacent NOR was followed. The strong difference in intensity between PNB (displayed in green) and NOR (in red) constrained us to first isolate the PNB from the NOR and apply a different threshold adapted to the intensity of each structure. To show the material flow between PNB and NOR, we have also displayed in pseudocolor and isolines a plane in the stack containing this flow (B). See also Video 6. (B′) Volumes defined by the surfaces of the labeled NOR and PNB in B were measured in time and plotted in a graph that shows how the volume (in voxels) of the NOR increases whereas that of the PNB decreases. See corresponding video for dynamic visualization. For Nop52 (C), flows are also observed, connecting the PNBs with the nucleolus. Finally, the signal decreases in the emptying PNB and increases in the NOR (A–C); compare fibrillarin at times 0 and 2 min, and Nop52 at times 1′40″ and 7′45″.
Figure 9
Figure 9
From telophase to an interphasic nucleolus. Time lapse sequence, with a 2.5-min frequency, shows the dynamics of Nop52 from the periphery of the chromosome, to PNB formation, and assembly in NORs followed by fusion of nucleoli. A detail of this fusion is also shown (inset). Bar, 10 μm. See also video 7 for 3-D nucleolar reconstruction and fusion of nucleoli in G1 phase.
Figure 7
Figure 7
Distribution of Nop52 in fixed cells compared with DNA condensation and fibrillarin in G1 cells. Three different planes are shown. G1 cells still show some chromosome condensation as observed by DNA specific coloration. A merge of the DNA (red) and Nop52 (green) shows that Nop52 localizes in the nucleolus and in PNBs aligning on partially condensed chromatin (arrowheads); protein bridges are observed between PNBs and nucleoli (*). Fibrillarin (blue) exclusively accumulates in the nucleolus colocalizing only partially with Nop52. Nucleoli (Nu) localize in areas of faint DNA staining. Bar, 10 μm.
Figure 10
Figure 10
Schematic reconstruction of the nucleolus. Proteins at the periphery of chromosomes (dashed line) assemble in PNBs attached to condensed chromatin (blue), and movements on the spot of these PNBs are observed (videos from Fig. 2 Fig. 3 Fig. 4 and Fig. 9). Different types of PNBs coexist in the nucleoplasm (gray or black). As the chromatin decondenses (not represented), some PNBs come into contact with newly forming nucleoli (NOR) and deliver their protein content; feeding from one PNB to another also exists. Several nucleoli are formed at this time and can fuse to one another. A certain lapse of time is required until the nucleolar components reorganize after the fusion (see Fig. 9 for how this distribution evolves in time for Nop52, a GC protein).
Figure 8
Figure 8
Structure of PNBs and modifications at the proximity of the nucleolus. Two early G1 Nop52-GFP HeLa cells are seen in phase contrast (A). Bar, 8 μm. The lefthand daughter cell is observed by fluorescence microscopy (A′): Nop52-GFP accumulates in the newly formed nucleolus and in seven PNBs, five of which are indicated by arrowheads. Bar, 2 μm. (A″) In an ultrathin section showing the same focus level as A′, the positions of the nucleolus and of the same five PNBs (arrowheads) are easily identified. Bar, 1 μm. Inset: detail of the central PNB with a fibrillogranular structure. Bar, 0.2 μm. (B–E) Electron micrographs of HeLa cell nuclei. (B) Late telophase. The chromatin (arrowheads) is decondensing and two PNBs are seen in the vicinity of the reforming nucleolus. The larger PNB is linked (arrow) to the condensed chromatin, and the connection between the smaller PNB and the DFC (d) is seen between the two arrows; fibrillar center (asterisk). Bar, 0.2 μm. (C) Early G1. A PNB appears linked to the condensed chromatin (arrowhead) via thin fibrils (long arrow); perichromatin granule (short arrow). Bar, 0.2 μm. (D) Early G1. Three PNBs are seen (thin arrows), one of them attached (thick arrow) to the nucleolus (Nu). Bar, 0.5 μm. (D′) Detail of the contact PNB-nucleolus, observed in D; note the granular material (between arrows) forming the link between the PNB and the GC (gc). Bar, 0.2 μm. (E) G1 phase. Two PNBs are associated with a nucleolus completely reformed. GC (gc); DFC (d). Material in the link (arrows), appears more diffuse than in D′. The top PNB is mainly composed of granules. Bar, 0.2 μm.

References

    1. Agard D.A., Hiraoka Y., Shaw P., Sedat J.W. Fluorescence microscopy in three dimensions. Methods Cell Biol. 1989;30:353–377. - PubMed
    1. Aris J.P., Blobel G. cDNA cloning and sequencing of human fibrillarin, a conserved nucleolar protein recognized by autoimmune antisera. Proc. Natl. Acad. Sci. USA. 1991;88:931–935. - PMC - PubMed
    1. Benavente R. Postmitotic nuclear reorganization events analyzed in living cells. Chromosoma. 1991;100:215–220. - PubMed
    1. Benavente R., Rose K.M., Reimer G., Hügle-Dörr B., Scheer U. Inhibition of nucleolar reformation after microinjection of antibodies to RNA polymerase I into mitotic cells. J. Cell Biol. 1987;105:1483–1491. - PMC - PubMed
    1. Clute P., Pines J. Temporal and spatial control of cyclin B1 destruction in metaphase. Nat. Cell Biol. 1999;1:82–87. - PubMed

Publication types

MeSH terms