

doi: 10.1073/pnas.111153698.
Epub 2001 May 29.
Recursive partitioning for tumor classification with gene expression microarray data
Affiliations
- PMID: 11381113
- PMCID: PMC34421
- DOI: 10.1073/pnas.111153698
Item in Clipboard
Recursive partitioning for tumor classification with gene expression microarray data
Proc Natl Acad Sci U S A.
.
Abstract
Precise classification of tumors is critically important for cancer diagnosis and treatment. It is also a scientifically challenging task. Recently, efforts have been made to use gene expression profiles to improve the precision of classification, with limited success. Using a published data set for purposes of comparison, we introduce a methodology based on classification trees and demonstrate that it is significantly more accurate for discriminating among distinct colon cancer tissues than other statistical approaches used heretofore. In addition, competing classification trees are displayed, which suggest that different genes may coregulate colon cancers.
Figures
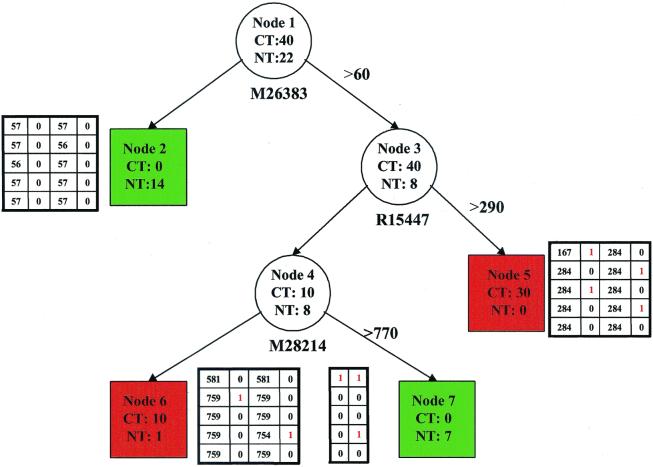
Classification trees for tissue types by using expression data from
three genes (M26383, R15447, M28214). Circles represent internal nodes
that are subsequently divided into daughter nodes. The boxes are
terminal nodes that do not have further partition and determine the
tissue class membership; the red ones contain a total of 40 cancer
tissues and 1 normal tissue, and the green ones contain 21 normal
tissues. Beneath each internal node is the gene whose expression level
is used to split the node, and the cutoff is displayed on the arrow
next to the right. The four companion tables provide the information of
the predictive precision of the tree based on a cross-validation
scheme; see text for details. CT, number of cancer tissues; NT, number
of normal tissues.
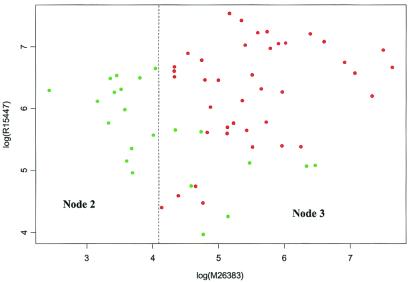
A scatter plot of expression data from M26383 and R15447. The dots are
colored in green and red for normal and cancer tissues, respectively.
The dotted line marks the cutoff value for node 1 in Fig. 1, and the
two regions are labeled with their corresponding nodes in the same
figure.

A scatter plot of expression data from R15447 and M28214 for a subset
of tissues (node 3 in Fig. 1). The dots are colored green and red for
normal and cancer tissues, respectively. The dotted lines mark the
cutoff values for nodes 3 and 4 in Fig. 1, and the three regions are
labeled with their corresponding nodes in the same figure.

Three-dimensional illustration of gene expressions from M26383, R15447,
and M28214, along with tissue types. The 40 points from cancer tissues
are labeled in red and the 22 points from normal tissues in green.
Because cancer tissues end up in two terminal nodes in Fig. 1 and so
are normal tissues, two levels of intensities for each of the red and
green colors are highlighted to indicate different terminal node
assignments of the same type of tissues.
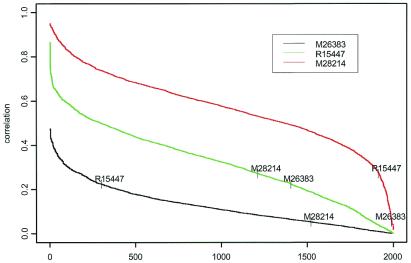
Correlation curves between the three selected gene expressions in Fig.
1 and the remaining expression data. Genes are sorted according to the
absolute correlation levels with one of the three selected genes and,
obviously, the orders are different among the three selected genes.

Classification trees for tissue types by using expression data from
three genes (R87126, T62947, X15183). Circles represent internal nodes
that are subsequently divided into daughter nodes. The boxes are
terminal nodes that do not have further partition and determine the
tissue class membership; the red ones contain a total of 40 cancer
tissues, and the green ones contain 22 normal tissues. Beneath each
internal node is the gene whose expression level is used to split the
node, and the cutoff is displayed on the arrow next to the right. The
four companion tables provide the information of the predictive
precision of the tree based on a cross-validation scheme; see text for
details. CT, number of cancer tissues; NT, number of normal tissues.

Three-dimensional illustration of the gene expressions from X15183,
R87126, and T62947, along with tissue types.
References
-
- Golub T R, Slonim D K, Tamayo P, Huard C, Gaasenbeek M, Mesirov J P, Coller H, Loh M L, Downing J R, Caligiuri M A, et al. Science. 1999;286:531–537. - PubMed
-
- Stephenson J. J Am Med Assoc. 1999;282:927–928. - PubMed
-
- Theillet C. Nat Med. 1998;4:767–768. - PubMed
-
- Strausberg R L, Austin M J F. Physiol Genomics. 1999;1:25–32. - PubMed
Publication types
MeSH terms
Grants and funding
LinkOut - more resources
Full Text Sources
Other Literature Sources
