. 2001 Jun;117(6):519-32.
doi: 10.1085/jgp.117.6.519.

Integrated allosteric model of voltage gating of HCN channels

Affiliations

Integrated allosteric model of voltage gating of HCN channels

C Altomare et al. J Gen Physiol. 2001 Jun.

Abstract

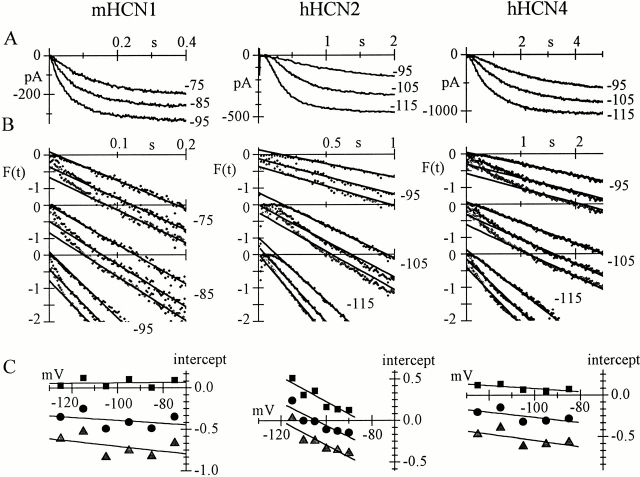
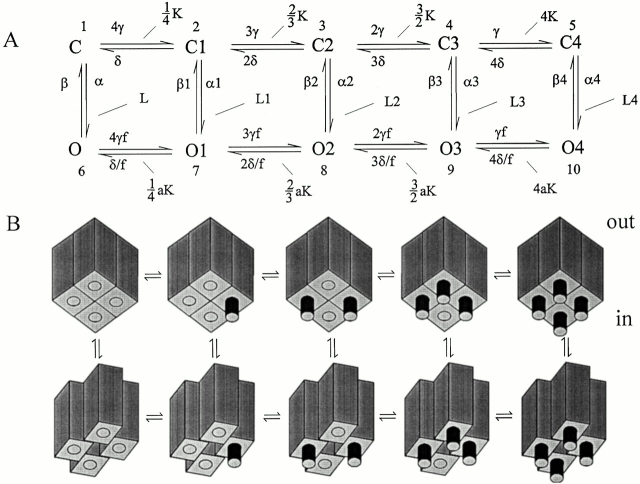
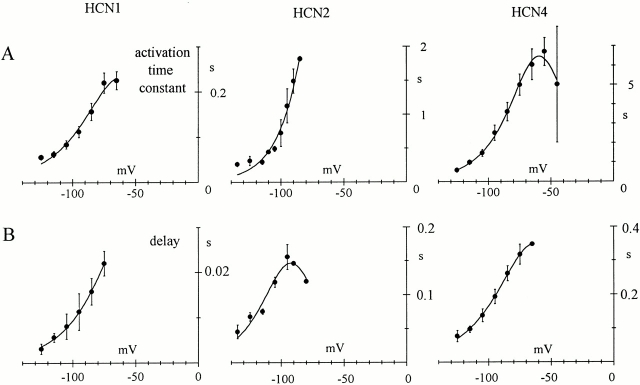
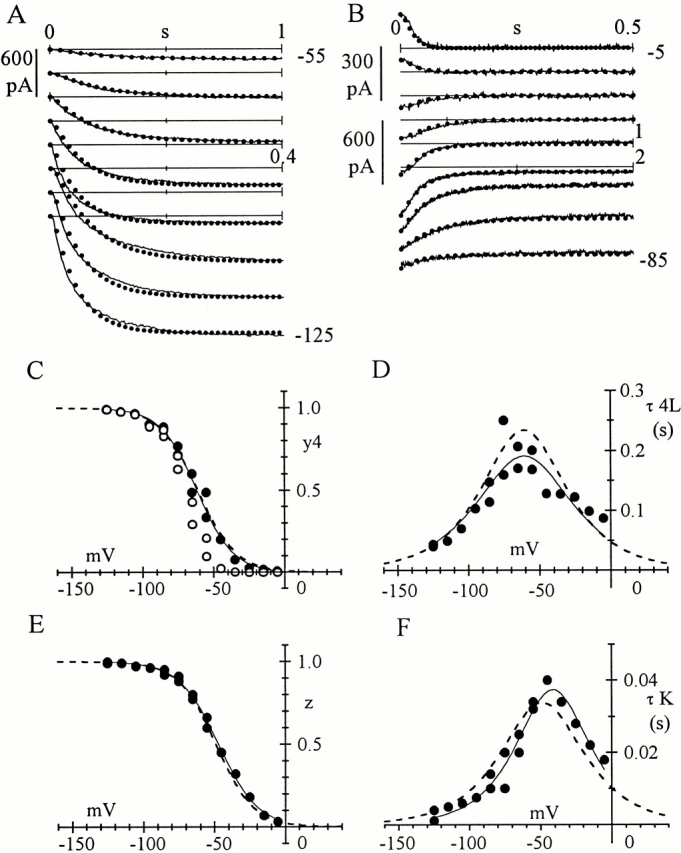
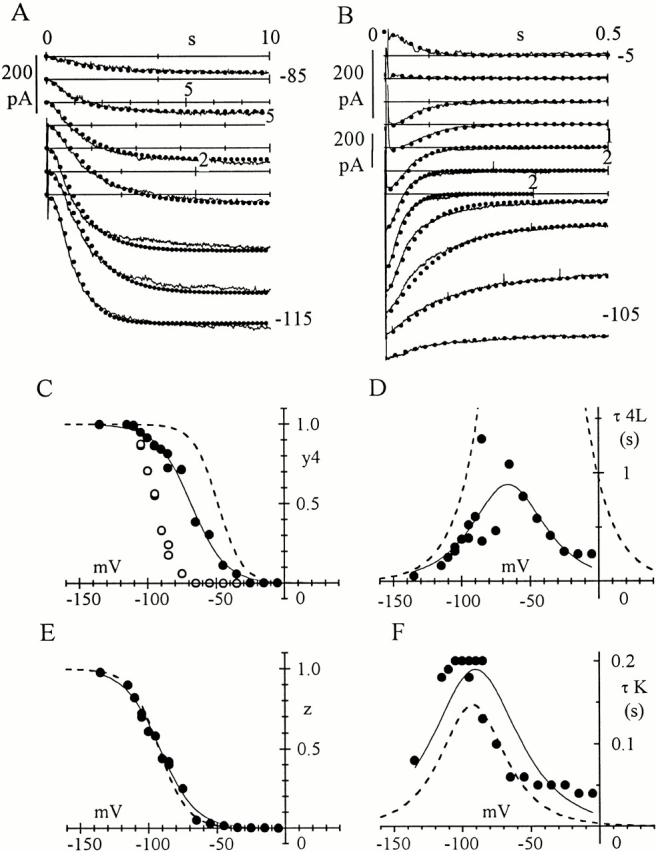
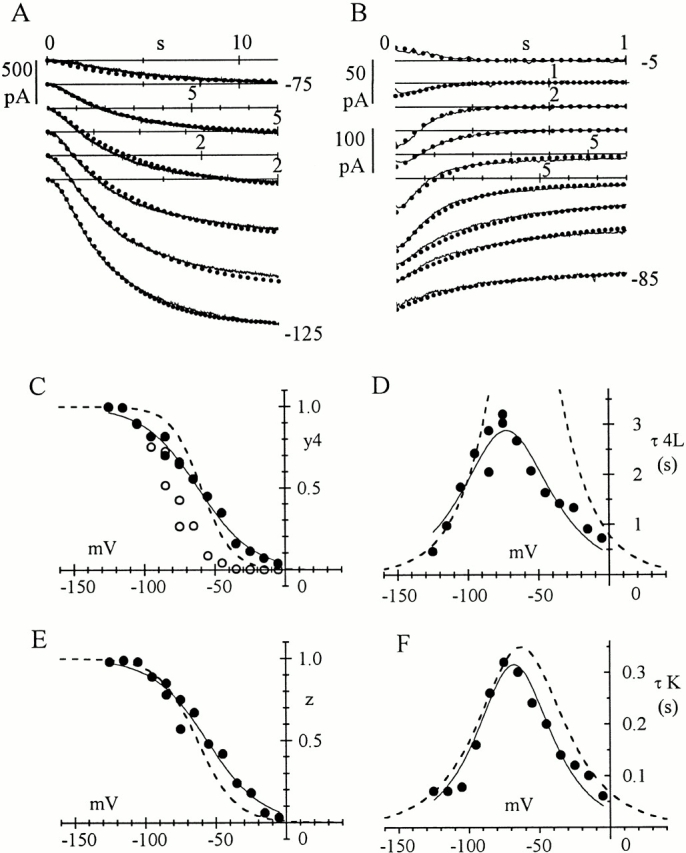
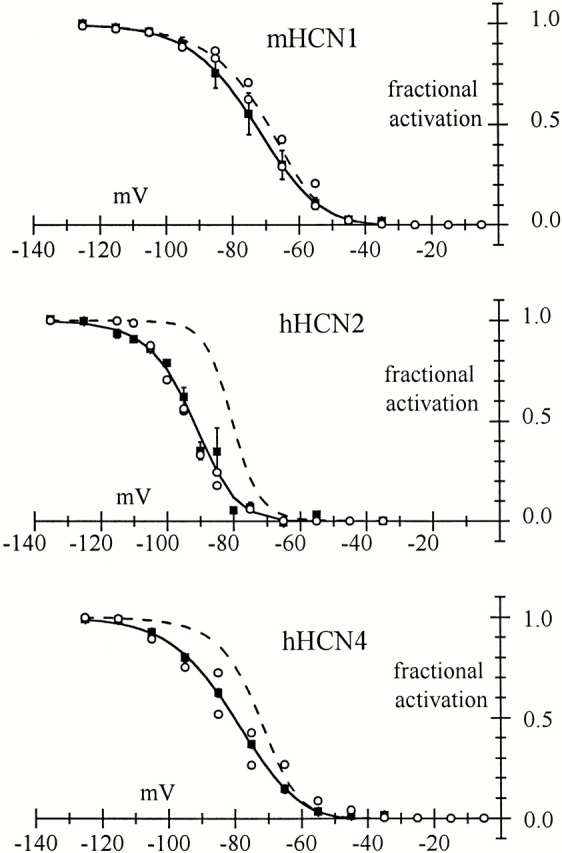
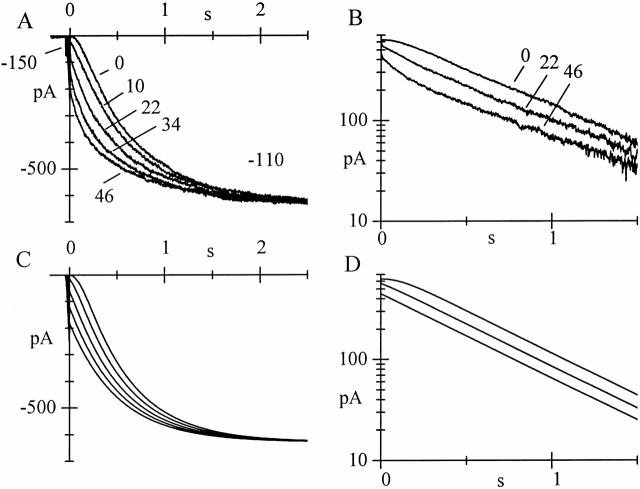
Hyperpolarization-activated (pacemaker) channels are dually gated by negative voltage and intracellular cAMP. Kinetics of native cardiac f-channels are not compatible with HH gating, and require closed/open multistate models. We verified that members of the HCN channel family (mHCN1, hHCN2, hHCN4) also have properties not complying with HH gating, such as sigmoidal activation and deactivation, activation deviating from fixed power of an exponential, removal of activation "delay" by preconditioning hyperpolarization. Previous work on native channels has indicated that the shifting action of cAMP on the open probability (Po) curve can be accounted for by an allosteric model, whereby cAMP binds more favorably to open than closed channels. We therefore asked whether not only cAMP-dependent, but also voltage-dependent gating of hyperpolarization-activated channels could be explained by an allosteric model. We hypothesized that HCN channels are tetramers and that each subunit comprises a voltage sensor moving between "reluctant" and "willing" states, whereas voltage sensors are independently gated by voltage, channel closed/open transitions occur allosterically. These hypotheses led to a multistate scheme comprising five open and five closed channel states. We estimated model rate constants by fitting first activation delay curves and single exponential time constant curves, and then individual activation/deactivation traces. By simply using different sets of rate constants, the model accounts for qualitative and quantitative aspects of voltage gating of all three HCN isoforms investigated, and allows an interpretation of the different kinetic properties of different isoforms. For example, faster kinetics of HCN1 relative to HCN2/HCN4 are attributable to higher HCN1 voltage sensors' rates and looser voltage-independent interactions between subunits in closed/open transitions. It also accounts for experimental evidence that reduction of sensors' positive charge leads to negative voltage shifts of Po curve, with little change of curve slope. HCN voltage gating thus involves two processes: voltage sensor gating and allosteric opening/closing.


Figures

Figure 1
Figure 1
Activation kinetics of HCN isoforms are not compatible with a fixed power of an exponential. (A) Sample current traces recorded on hyperpolarization to the voltages indicated from a holding potential of −35 mV in Phoenix cells expressing HCN1 (left), HCN2 (middle), and HCN4 (right). Voltage steps were long enough to reach steady state for each trace, and only a fraction of the records is shown on an expanded time scale to highlight the time course at early times. (B) Plots of the functionF(t) = ln(1 − (I(t)/I)1/n),where I is current and I the steady-state current value for traces in A, at the voltages indicated. For each voltage, the function F(t) was plotted for values of n = 1, 2, and 3 (top to bottom trace) and the linear part fitted by straight lines (full lines). Traces at different voltages are shifted vertically for clarity. If activation occurs according to the nth power of an exponential of time constant τ, then F(t) = −t/τ and F(t) plots should be straight lines with zero y-intercept. (C) Values of vertical intercepts at t = 0 of linear fittings of F(t) plots in B, plotted against voltage for n = 1 (squares), n = 2 (circles) and n = 3 (triangles). These values represent “delays” (if positive) or “anticipations” (if negative) relative to a time course developing according to the selected power of exponential.
Figure 2
Figure 2
Proposed allosteric scheme of voltage gating of HCN channels. (A) Reaction scheme. (B) Physical model; only one of the possible configurations with 1, 2, or 3 willing sensors are shown. The channel is assumed to be composed of four identical subunits, each carrying one voltage sensor (round bars in B) that can assume two different configurations: one “reluctant” (hidden) and one willing (protruding from the subunit) to help the opening process. Closed/open transitions occur allosterically and involve concerted structural modifications of all four subunits. This results in 10 different states, 5 closed (C–C4) and 5 open (O–O4). Labels 1–4 identify the number of voltage sensors in the willing position (zero unlabeled). States are numbered 1–10 (in A) to allow matrix identification of rate constants (see ). Voltage sensors act independently of the subunit to which they belong. Each rate constant is multiplied by the number of possible transitions. To reproduce hyperpolarization-induced activation, the model assumes a voltage dependence of rate constants favoring left-to-right and top-to-bottom transitions upon hyperpolarization, which according to the Boltzmann equation ( of appendix) describing α, β, γ, and δ implies zα < 0, zβ > 0, zγ < 0, and zδ > 0. Transition of any one voltage sensor to the willing state is assumed to increase the probability of channel opening. This is achieved by multiplying closed/open equilibrium constants by a constant value (a < 1) any time one sensor moves to the willing position (L to L1, L1 to L2, etc.). Assuming “balanced” rate constant changes, this implies that opening rate constants are divided by √a (α to α1, α1 to α2, etc.), and closing rate constants are multiplied by √a (β to β1, β1 to β2, etc.). Because of the cyclic arrangement, similar relations hold for reluctant/willing equilibrium constants and rate constants when channels switch from closed to open. Defining f = 1/√a, the following relations thus hold (see ): K=4CC1=3C12C2=2C23C3=C34C4=δγ;aK=δfγf=Kf2L=CO=βα;Li=CiOi=βiαi=aiLi=1–4αi=αfi;βi=βifii=1–4
Figure 3
Figure 3
(A) Voltage dependence of time constants (mean ± SEM) measured by fitting activation current traces by single exponentials after an initial delay for HCN1 (left, n = 9), HCN2 (middle, n = 7), and HCN4 channels (right, n = 13). Data points were fitted with the equation τ4L(V) = 1/(α4(V) + β4(V)) = 1/(α(V)/a2 + β(V)a2)), with a = 0.2 and α(V) and β(V) as in , which yielded the following parameters: for HCN1, αo = 0.008716 s−1, βo = 522.6 s−1, and zβ(= −zα) = 0.9674; for HCN2, αo = 0.0001712 s−1, βo = 26.17 s−1, and zβ(= −zα) = 1.465; and for HCN4, αo = 0.0001912 s−1, βo = 31.27 s−1, and zβ = (−zα) = 1.211. (B) Voltage dependence of the delay preceding single exponential time course of currents (mean ± SEM) during hyperpolarization for HCN1 (left, n = 9), HCN2 (middle, n = 5) and HCN4 channels (right, n = 10). Data points were fitted with the equation τK(V) = 1/(δ(V) + γ(V)), with δ(V) and γ(V) as in , which yielded the following parameters: for HCN1, γo = 2.296 s−1, δo = 95.14 s−1, and zδ(= −zγ) = 0.9853; for HCN2, γo = 0.04025 s−1, δo = 287.5 s−1,and zδ(= −zγ) = 1.242; and for HCN4, γo = 0.1387 s−1, δo = 14.78 s−1, and zδ(= −zγ)= 0.9577. All values of best-fitting parameters are reported in Table .
Figure 4
Figure 4
Simulation of activation and deactivation kinetics of HCN1 channel by allosteric model. Computations were carried out as outlined in the materials and methods. (A) Activation traces recorded in a cell (lines) during steps from −35 mV to voltages in the range −55 to −125 mV (10-mV steps), as indicated, and corresponding computed traces (dots). Traces displaced vertically for clarity. (B) Deactivation traces recorded in the same cell (lines) during steps to the range −85 to −5 mV (10-mV steps), as indicated, preceded by a 1.2-s activation step to −125 mV from the holding potential of −35 mV, and corresponding computed traces (dots). The top three traces (−5, −15, and −25 mV) are plotted on a more expanded current scale. Traces at −55 to −85 mV are plotted on the same scale, and the remaining records are shifted vertically for clarity. (C and E) Plots of individual fractional activation values y4 (C) and z (E) (closed circles) used to fit individual experimental traces in A and B (for definition of y4 and z, see ). Also plotted for comparison are the theoretical curves y4(V) and z(V) calculated with the rate constant parameters in Table (broken lines) and the curves obtained by best-fitting of data points with the functions (; full lines). Best-fitting yielded the values: V4L= −61.71 mV; VK = −47.12 mV; zβ = 1.019; zδ = 0.9310. Also plotted in C are open probability (Po) values obtained by the fitting parameters according to (open circles). (D and F) Plots of time constant values τ4L (D) and τK (F) () used to fit experimental records in A and B, along with the theoretical curves τ4L(V) (D) and τK(V) (F) calculated from parameters in Table (broken lines) and with best-fitting curves (full lines). Best-fitting yielded the following values: V4L = −60.74 mV; VK = −41.24 mV; zβ = 0.8551; zδ = 1.105; α4o = 0.3515 s−1; γo = 2.289 s−1.
Figure 5
Figure 5
Simulation of activation and deactivation kinetics of HCN2 channel by allosteric model. Computations as in Fig. 4. (A) Activation traces recorded in a cell (lines) during steps from −35 mV to voltages in the range −85 to −115 mV (5-mV steps), as indicated, and corresponding computed traces (dots). Traces are displaced vertically for clarity. (B) Deactivation traces recorded in a different cell (lines) during steps to the range −5 to −105 mV (10-mV steps), as indicated, preceded by a 1-s activation step to −135 mV from the holding potential of −35 mV, and corresponding computed traces (dots). The top three traces (−5, −15, and −25 mV) are plotted on a more expanded current scale. Traces at −65 to −105 mV are plotted on the same scale, and the remaining records are shifted vertically for clarity. (C and E) Plots of fractional activation values y4 (C) and z (E) (closed circles) used to fit individual experimental traces in A and B () and their best-fitting curves (full lines) along with the theoretical curves y4(V) and z(V) calculated with the parameters in Table (broken lines). Best-fitting yielded the following values: V4L = −68.26 mV, VK = −91.61 mV, zβ = 1.023, and zδ = 1.003. Also plotted in C are Po values obtained by the fitting parameters according to (open circles). (D and F) Plots of time constant values τ4L (D) and τK (F) () used to fit experimental records in A and B along with their best-fitting curves (full lines), and the theoretical curves τ4L(V) (D) and τK(V) (F) calculated from parameters in Table (broken lines). Best-fitting yielded the following values: V4L = −66.05 mV,; VK = −101.5 mV, zβ = 1.110, zδ = 1.040, α4o = 0.0327 s−1, and γo = 0.04214 s−1.
Figure 6
Figure 6
Simulation of activation and deactivation kinetics of HCN4 channel by allosteric model. Computations as in Fig. 4. (A) Activation traces recorded in a cell (lines) during steps from −35 mV to voltages in the range −75 to −125 mV (10-mV steps), as indicated, and corresponding computed traces (dots). Traces displaced vertically for clarity. (B) Deactivation traces recorded in a different cell (lines) during steps to the range −5 to −85 mV (10-mV steps), as indicated, preceded by a 2-s activation step to –125 mV from the holding potential of –35 mV, and corresponding computed traces (dots). The top three traces (−5, −15, and −25 mV) are plotted on a more expanded current scale. Traces at −55 to −85 mV are plotted on the same scale, and the remaining records are shifted vertically for clarity. (C and E) Plots of fractional activation values y4 (C) and z (E) (closed circles) used to fit individual experimental traces in A and B () and their best-fitting curves (full lines) along with the theoretical curves y4(V) and z(V) calculated with the parameters in Table (broken lines). Best-fitting yielded the following values: V4L = −61.66 mV; VK =−56.22 mV; zβ = 0.67; and zδ = 0.6729. Also plotted in C are Po values obtained by the fitting parameters according to (open circles). (D and F) Plots of time constant values τ4L (D) and τK (F) () used to fit experimental records in A and B along with their best-fitting curves (full lines), and of the theoretical curves τ4L(V) (D) and τK(V) (F) calculated from parameters in Table (broken lines). Best-fitting yielded the values: V4L = −72.68 mV; VK = −68.07 mV; zβ = 0.9384; zδ = 1.114; α4o = 0.0124 s−1; and γo = 0.08444 s−1.
Figure 7
Figure 7
Fitting of activation curves for HCN1, HCN2 and HCN4. Activation curves were measured as explained in materials and methods in cells expressing HCN1 (n = 8), HCN2 (n = 3) and HCN4 channels (n = 11). Data points (closed squares) are plotted as mean ± SEM values. The curves were fitted with : Po=11+LV1+1KV1+1aKV4,where the voltage dependence of L and K is described by and . In the fitting procedure, initial values of the parameters were those reported in Table (broken lines). Best-fitting yielded the following parameters: for HCN1 (top), zβ = 1.212, zδ = 1.150, VL = −140.6 mV (V4L = −71.94 mV), and VK =−34.4 mV; for HCN2 (middle), zβ =1.501, zδ =1.032, VL =−143.3 mV (V4L =−87.86 mV), and VK = −68.9 mV; and for HCN4 (bottom), zβ = 1.255, zδ = 1.540, VL = −145.9 mV (V4L = −79.60 mV), and VK = −46.1 mV. V4L values were calculated according to . Also plotted for comparison (open circles) are Po values obtained from the kinetic analysis of Fig. 4– 6.
Figure 8
Figure 8
Removal of activation delay by prehyperpolarization and prediction of allosteric model. (A) Current traces recorded from a cell expressing HCN4 channels during 3-s steps to −110 mV after prehyperpolarizations to −150 mV for 0, 10, 22, 34, and 46 ms, as labeled. Holding potential was −35 mV. (C) Model traces were computed by first fitting experimental records during steps from −35 to −150 and −110 mV (as in Fig. 6), and then running −150/−110-mV two-step computations with the same prehyperpolarization durations as in experimental records (traces not labeled for clarity). Values of parameters y4, z, τ4L, and τK used to fit traces were as follows: 0.9998, 0.99, 0.0919, and 0.01 s at −150 mV; and 0.9819, 0.98, 0.491, and 0.08 s at −110 mV, respectively. (B and D) Semilog plots of experimental (B) and theoretical traces (D) at −110 mV corresponding to 0, 22, and 46 ms prehyperpolarizing steps to −150 mV (as labeled in B). In all plots, currents are referred to their steady-state level (630 pA).
Figure 9
Figure 9
Allosteric model prediction of Po dependence on equivalent charge number of voltage sensor transitions. Calculations were performed for HCN2 channels using the parameters in Table . (A) Willing/reluctant distribution parameter (z) calculated with and in reference conditions (control) and after reduction of the equivalent charge number (zδ = 1.021) by 1/6, 2/6, 3/6, and 4/6 (1–4). This was meant to mimic replacement of one to four basic residues with neutral ones in the simplified assumption that each residue contributes the same charge and that only six of the nine basic residues of S4 sense voltage changes. The latter hypothesis is based on the consideration that since S4 of HCN2 extends for 28 amino acids, more than the length of a membrane spanning α-helix (∼20 amino acids), only a fraction of the full S4 length is likely to sense voltage changes (Chen et al. 2000). The slope of the distribution curve at midpoint voltages decreases in proportion to zδ. (B) Po curves calculated by with A9 and A14 with the same zδ values as in A, as indicated. The curve midpoint shifts to more negative voltages by 10.2, 22.9, 37, and 46.9 mV (1–4), whereas the slope decreases minimally with decreases of zδ.
Figure 10
Figure 10
Comparison of allosteric gating parameters among HCN isoforms. In the plots the parameters y4 (A), τ4L (B), z (C,) and τK (D) determined by fitting kinetic data in Fig. 4 Fig. 5 Fig. 6 are superimposed along with their best-fitting curves (lines) for the isoforms HCN1 (closed circles), HCN2 (open circles), and HCN4 (closed triangles).

Similar articles

Cited by

References

    1. Chen J., Mitcheson J.S., Lin M., Sanguinetti M.C. Functional role of charged residues in the putative voltage sensor of the HCN2 pacemaker channel. J. Biol. Chem. 2000;275:36465–36471. - PubMed
    1. Clapham D.E. Not so funny anymorepacing channels are cloned. Neuron. 1998;21:1–5. - PubMed
    1. DiFrancesco D. Characterization of the pacemaker current kinetics in calf Purkinje fibres. J. Physiol. 1984;348:341–367. - PMC - PubMed
    1. DiFrancesco D. The cardiac hyperpolarizing-activated current, if. Origins and developments. Prog. Biophys. Mol. Biol. 1985;46:163–183. - PubMed
    1. DiFrancesco D. Pacemaker mechanisms in cardiac tissue. Annu. Rev. Physiol. 1993;55:455–472. - PubMed

Publication types

Grants and funding