. 2001 Jun;117(6):563-72.
doi: 10.1085/jgp.117.6.563.

Single-channel properties of recombinant acid-sensitive ion channels formed by the subunits ASIC2 and ASIC3 from dorsal root ganglion neurons expressed in Xenopus oocytes

Affiliations

Single-channel properties of recombinant acid-sensitive ion channels formed by the subunits ASIC2 and ASIC3 from dorsal root ganglion neurons expressed in Xenopus oocytes

P Zhang et al. J Gen Physiol. 2001 Jun.

Abstract

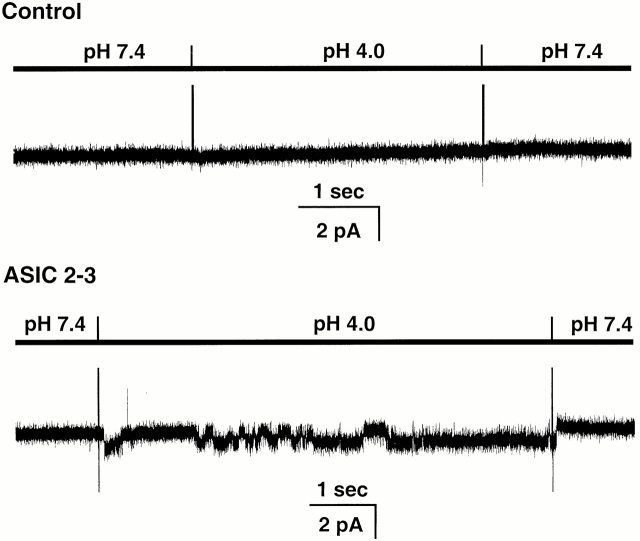
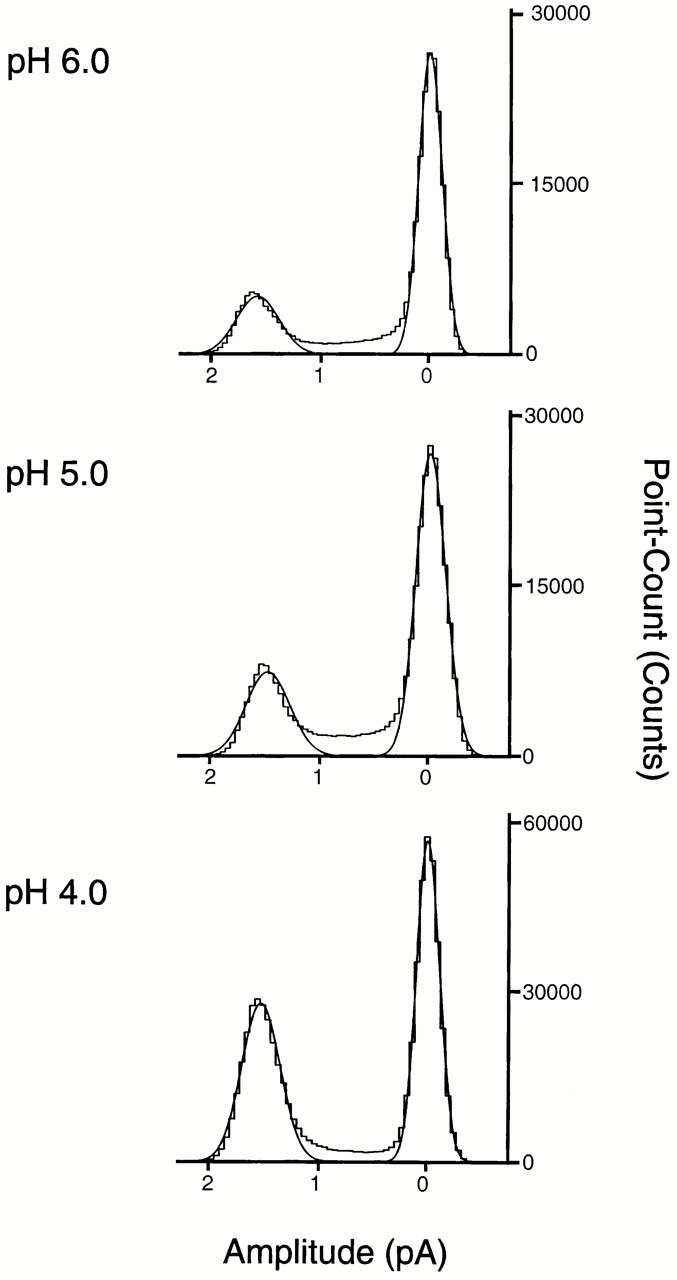
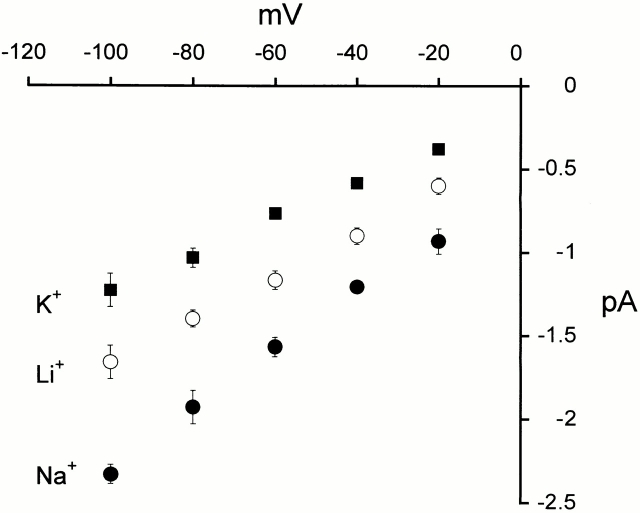
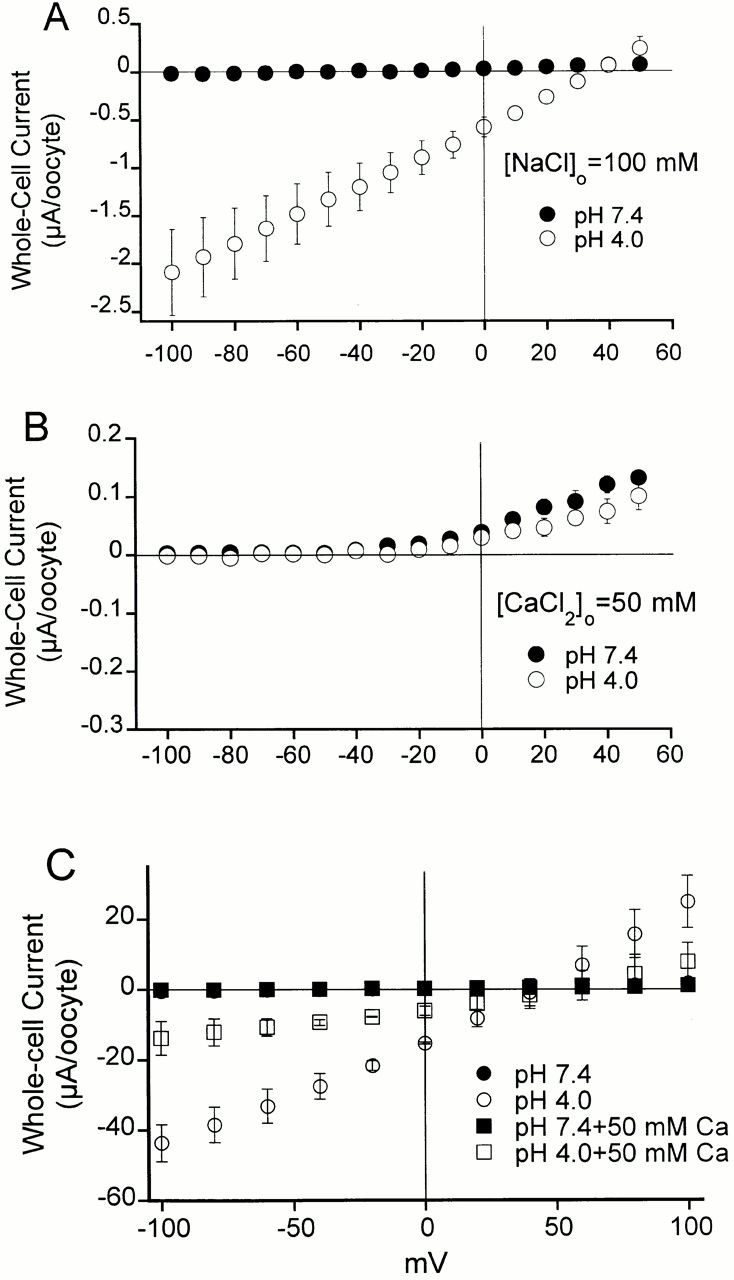
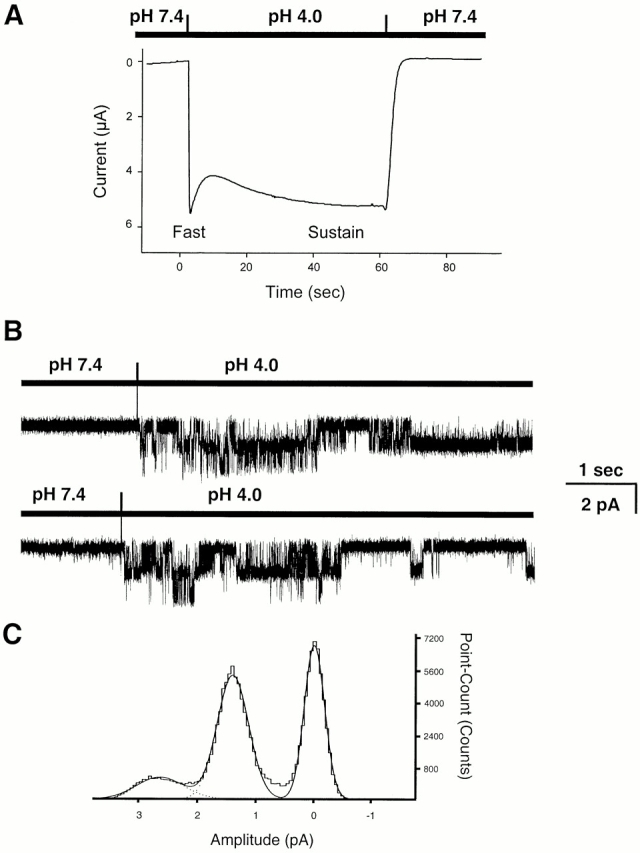
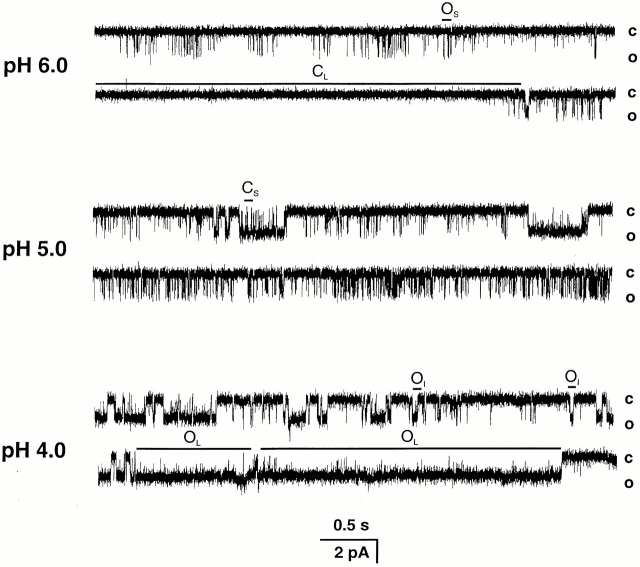
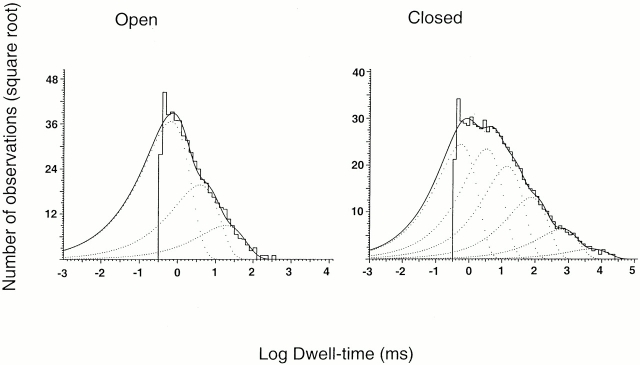
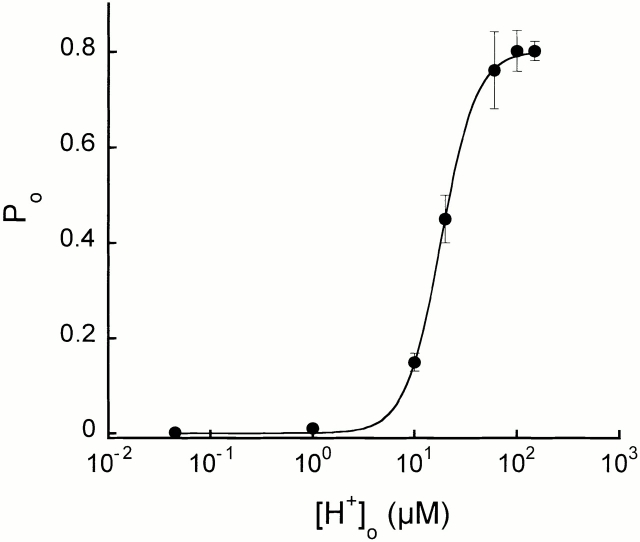
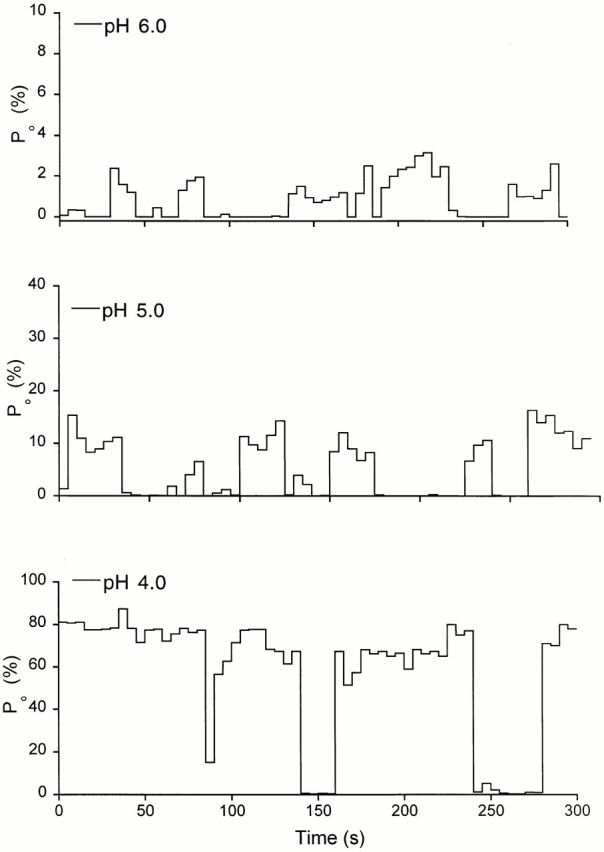
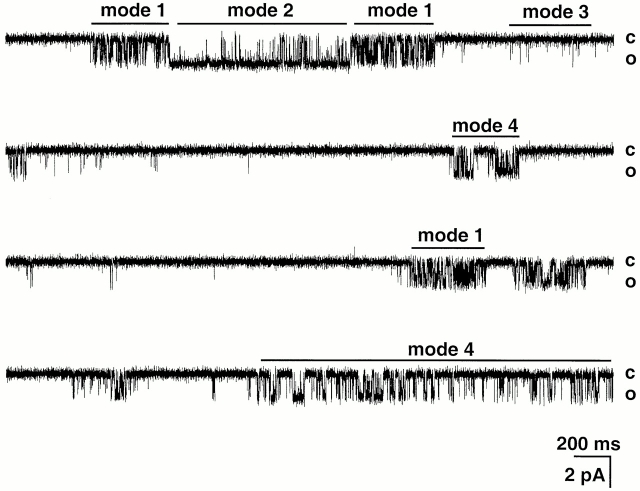
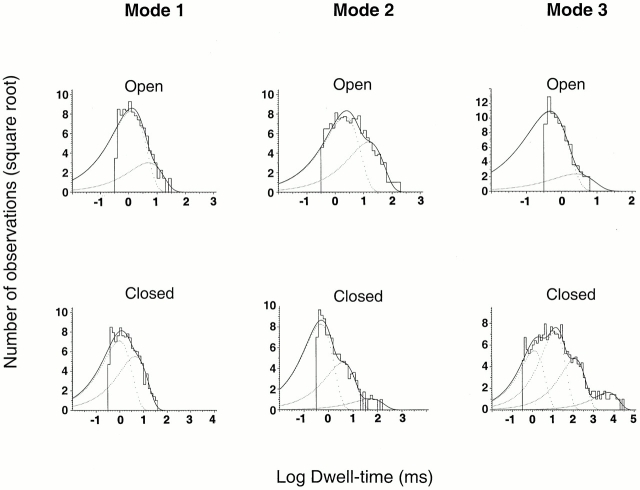
The acid-sensitive ion channels known as ASIC are gated by external protons. A set of these channels is expressed in dorsal root ganglion neurons where they may participate in the transduction of mechanical and nociceptive stimuli. Here, we have examined the single-channel properties of channels formed by the subunits ASIC2 and ASIC3 expressed in Xenopus oocytes using outside-out patches. The mean single-channel current-voltage relationship is linear with a slope conductance of 18 pS between -80 and -40 mV in 150 mM Na(+) outside and 150 mM K(+) inside the patch pipet. The selectivity for monovalent cations has the sequence Na(+) > Li(+) > K(+). Divalent cations such as Ca(2+) do not permeate, but instead block the channel when applied to the extracellular side. External protons increase the probability of channels being open to a maximum of 0.8 with an EC(50) of 16 +/- 4 microM and a Hill coefficient of 2.7 +/- 0.3, whereas the mean single-channel current amplitude is independent of external pH. Analysis of the kinetics of single channels indicates the presence of at least four modes of activity (Mod1 to Mod4) in addition to an inactivated state. Three of the modes exhibit distinct kinetics, and can be unambiguously identified on the basis of open probability (P(oMod1) = 0.5 +/- 0.05; P(oMod2) > 0.9 +/- 0.05; P(oMod3) < 0.1). Mode 4, which has a P(o) in the range of 0.5-0.8, may constitute a distinct mode or alternatively, it represents transitions between the other three modes of activity. Increasing [H(+)](o) increases the frequency of entering the modes with high P(o) (modes 1, 2, and 4) and the time the channel spends in the modes with high activity.


Figures

Figure 1
Figure 1
Response of outside-out patches to a pHo 4.0 solution from control and injected oocytes with ASIC2-3 cRNAs. External protons evoke inward currents (downward deflections) only in oocytes injected with ASIC2-3. In none of the ∼40 control oocytes we observed acid-activated channels. The bars above the traces indicate the applied pHo. Membrane potential was −20 mV. The outside solution contained 150 mM NaCl, and the pipet solution contained 150 mM KCl.
Figure 2
Figure 2
All-points amplitude histograms of single-channel currents elicited by solutions of pHo 6.0, 5.0, and 4.0 recorded from outside-out patches at −80 mV and with 150 mM Na+ in the bath and 150 mM K+ in the pipet. The distributions were fitted by the sum of two Gaussian components (continuous lines). The mean amplitude of the open state is −1.8 ± 0.01 pA for the three different pHo solutions. The areas under the curves are as follows: 0.2 and 0.8 at pHo 6.0; 0.28 and 0.72 at pHo 5.0; and 0.45 and 0.55 at pHo 4.0. Since the average Po at pHo 6.0 is low, we chose a segment of high activity to obtain a significant number of points on the open state.
Figure 3
Figure 3
Current-voltage relationships of single-channel currents. Mean I-V relationship of single-channel currents from outside-out patches activated by pHo of 4.0 recorded at membrane potentials from −100 to −20 mV. External solution contained 150 mM of Na+, Li+, or K+, and internal solution contained 150 mM K+. Data points represent the mean of at least three independent measurements. The error bars indicate ±SD.
Figure 4
Figure 4
Mean I-V relationships of whole-cell currents from oocytes expressing ASIC2-3 measured with a two-electrode voltage clamp. (A) The external solution contains 100 mM NaCl buffered at pH 7.4 or 4.0; voltage range of membrane potential was −100 to 50 mV. (B) The external solution contains 50 mM CaCl2 without Na+, buffered to pH 7.4 or 4.0; voltage range of membrane potential was −100 to 50 mV. Notice the change in the scale of the vertical axis. Inward and outward currents become very small in the absence of Na+, and the symbols representing the currents at pHo 7.4 and 4.0 are almost superimposed. (C) The external solution contains 100 mM NaCl and 50 mM Ca2Cl buffered at pH 7.4 or 4.0. At pHo 7.4, no currents are detected; black squares and circles are superimposed. To better observe the effect of Ca2+ on both inward and outward currents, the voltage range of the membrane potential was expanded from −150 to 100 mV. Each data point is the mean of three to four oocytes ±SD.
Figure 5
Figure 5
Fast and sustain components of ASIC2-3 currents. (A) Whole-cell currents elicited by changing the pHo from 7.4 to 4.0 in an oocyte expressing ASIC2-3. The initial current (fast component) partially inactivates and it is followed by a sustain component. Holding potential −60 mV; bath solution contains 100 mN Na+. (B) Outside-out patches showing the activation of channels immediately after changing the external solution from pHo 7.4 to 4.0. Initially, two channel levels are apparent, but after 2.5 s, one of the channels closes. Holding potential −40 mV; outside solution contains 150 mM Na+, and pipet solution contains 150 K+. (C) All-points amplitude histogram from patches showed in B. The distributions were fitted by the sum of three Gaussian components (continuous lines). The mean amplitudes of the open states were −1.3 ± 0.2 pA and −2.6 ± 0.3 for one and two open levels, respectively.
Figure 6
Figure 6
Representative examples of outside-out patches containing single ASIC2-3 channels activated by increasing concentrations of external protons, pHo 6.0, 5.0, and 4.0. Activity of the channel and Po increase with increasing [H+]o. At pHo 6.0, the openings are short and are separated by closed events of variable duration, some of which last several hundred milliseconds. At pHo 5.0, the short openings increase in frequency and longer openings are apparent. At pHo 4.0, there is a further increase in Po due to long openings. The closed and open levels are indicated on the right side. OS, OI, and OL indicate short, intermediate and long open states, respectively. CS and CL indicate short and long closed states, respectively. Bath solution contained 150 mM Na+, and pipet solution contained 140 mM K+. Membrane potential was held at −60 mV. The data were recorded at 5 kHz and filtered at 1 kHz for display. The bars on the bottom indicate the time and amplitude scales in pA and seconds, respectively.
Figure 7
Figure 7
Dwell-time histograms of open and closed events collected from three outside-out patches activated with pHo 5.0. Lines represent the fit of the data of open events with three exponentials. Mean time constant (relative area shown in parentheses) are as follows: 0.66 ms (0.74), 3.9 ms (0.21), and 19 ms (0.05). The closed events were fitted with the following six exponential components: 0.55 ms (0.34), 3.3 ms (0.31), 14 ms (0.21), 75 ms (0.08), 606 ms (0.04), and 4880 ms (0.02).
Figure 8
Figure 8
External proton dose–response curve. Open probability of ASIC2-3 was plotted for each increment of [H+]o. Fit of the data to the Hill equation is shown the in solid line. The calculated values were as follows: EC50 = 16 μM, Hill coefficient = 2.7, and maximum Po = 0.8. Symbols represent the mean Po obtained from at least 10,000 open and closed events. For some of the points, two to three patches activated by the same pHo were combined to have sufficient number of events for the analysis.
Figure 9
Figure 9
Variations of the open probability of ASIC2-3 channels over time. We selected patches containing single channels that lasted for 5 min or longer of continuous recording after activation by solutions of pHo 6.0, 5.0, and 4.0. The Po was averaged each 5 s and plotted over 300 s.
Figure 10
Figure 10
Modes of activity of ASIC2-3 channels. The figure shows a continuous record of a single channel activated by pHo 4.0. The channel exhibits sudden changes in kinetics, which are indicated by bars labeled mode 1, mode 2, mode 3, and mode 4. Holding potential was −80 mV. External and internal solutions contained 150 mM NaCl and 150 KCl, respectively. Closed and open levels are indicated on the right. Current amplitude and time scales are indicated by the bars at the bottom of the record.
Figure 11
Figure 11
Dwell-time histograms of open and closed events corresponding to modes 1, 2, and 3. A long record from a single channel activated by pHo 4.0, containing 50,000 events was analyzed for moving mean Po calculated with 100 successive open and close intervals. We assigned to mode 1 segments of the record with Po 0.5 ± 0.05, to mode 2 Po > 0.6, and to mode 3 Po < 0.1. Events from each mode were pooled and used to construct histograms of open and closed events. (mode 1) The distributions of open times were fitted with the sum of two exponential components with parameters (mean time constant, with the relative area shown in parentheses): 1.24 ms (0.88) and 4.94 ms (0.11). The distributions of closed times were fitted with the sum of two exponential components: 0.98 ms (0.62) and 4.5 ms (0.37). (mode 2) Distributions of open times: 2.24 ms (0.69) and 15.14 ms (0.31). Distributions of closed times were fitted with three exponential components: 0.48 ms (0.76), 3.87 ms (0.23), and 51.2 ms (0.13). (mode 3) Distributions of open times: 0.46 ms (0.94) and 2.0 ms (0.055). Distributions of closed times were fitted with four exponential components: 1.24 ms (0.28), 13 ms (0.48), 121.8 ms (0.21), and 5,209 ms (0.024).

Similar articles

Cited by

References

    1. Akaike N., Krishtal O.A., Maruyama T. Proton-induced sodium current in frog isolated dorsal root ganglion cells. J. Neurophysiol. 1990;63:805–813. - PubMed
    1. Akopian A.N., Chen C.C., Ding Y., Cesare P., Wood J.N. A new member of the acid-sensing ion channel family. Neuroreport. 2000;11:2217–2222. - PubMed
    1. Babinski K., Catarsi S., Biagini G., Séguéla P. Mammalian ASIC2a and ASIC3 subunits co-assemble into heteromeric proton-gated channels sensitive to Gd3+ . J. Biol. Chem. 2000;275:28519–28525. - PubMed
    1. Bevan S., Yeats J. Protons activate a cation conductance in a sub-population of rat dorsal root ganglion neurons. J. Physiol. 1991;433:145–161. - PMC - PubMed
    1. Blatz A.L., Magleby K.L. Quantitative description of three modes of activity of fast chloride channels from rat skeletal muscle. J. Physiol. 1986;378:141–174. - PMC - PubMed

Publication types