. 2001 Jun 1;20(11):2723-41.
doi: 10.1093/emboj/20.11.2723.

Ezrin is a downstream effector of trafficking PKC-integrin complexes involved in the control of cell motility

Affiliations

Ezrin is a downstream effector of trafficking PKC-integrin complexes involved in the control of cell motility

T Ng et al. EMBO J. .

Abstract

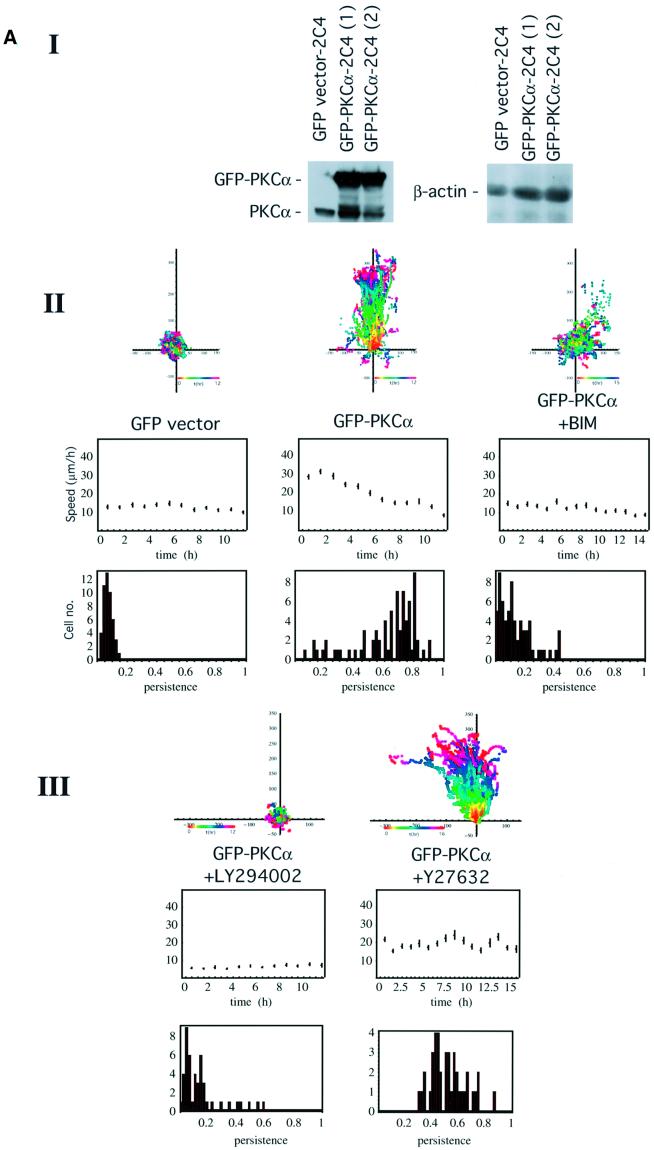
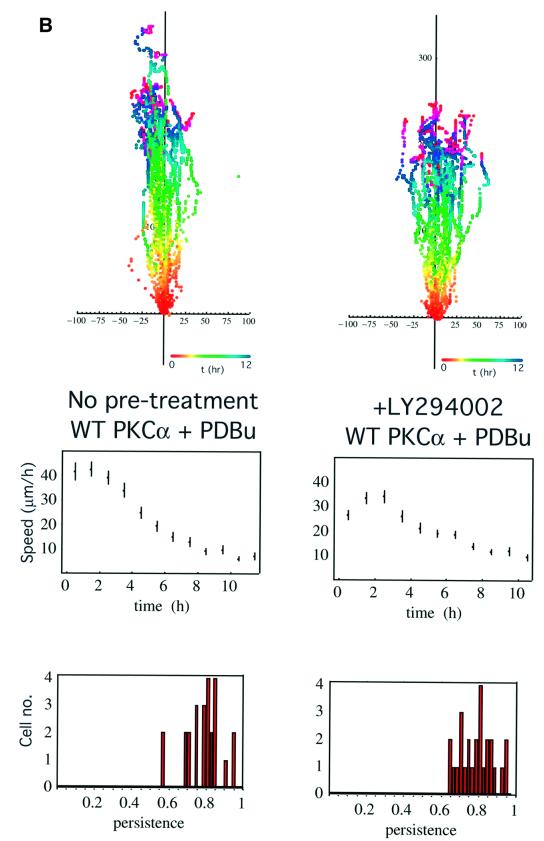
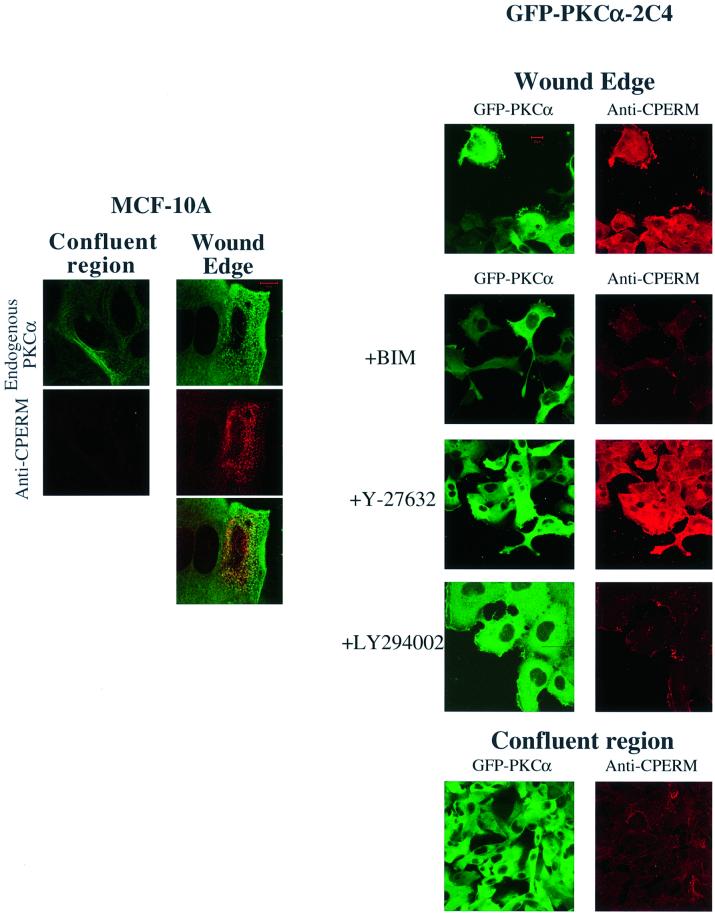
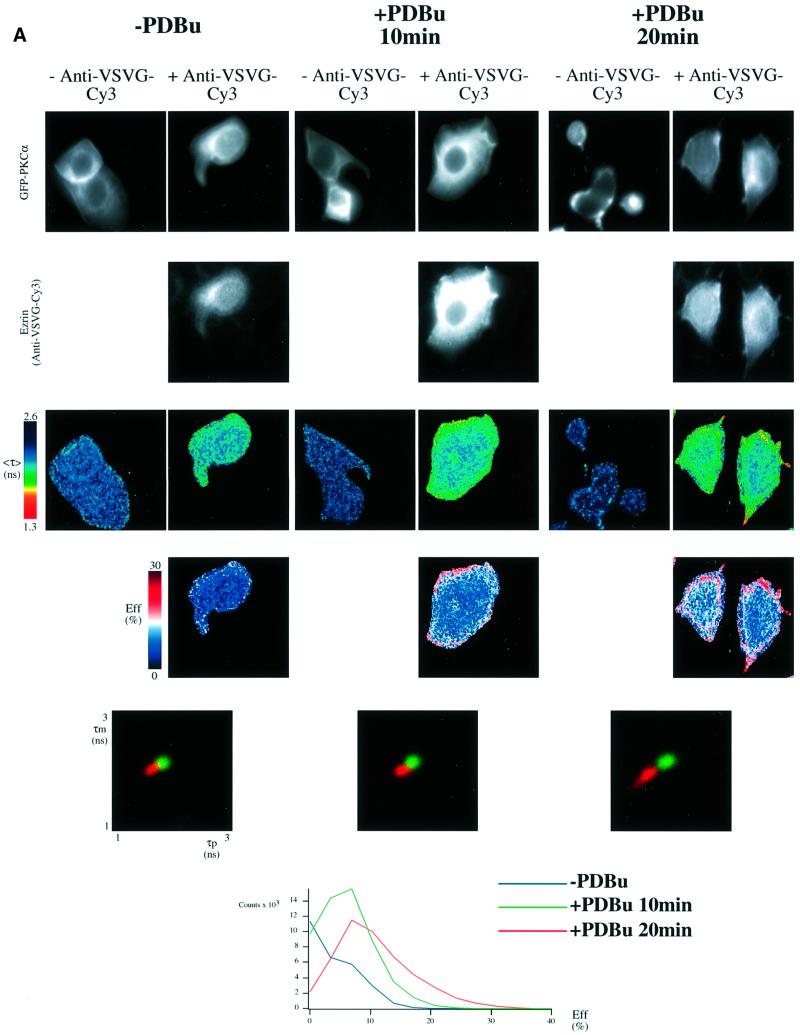
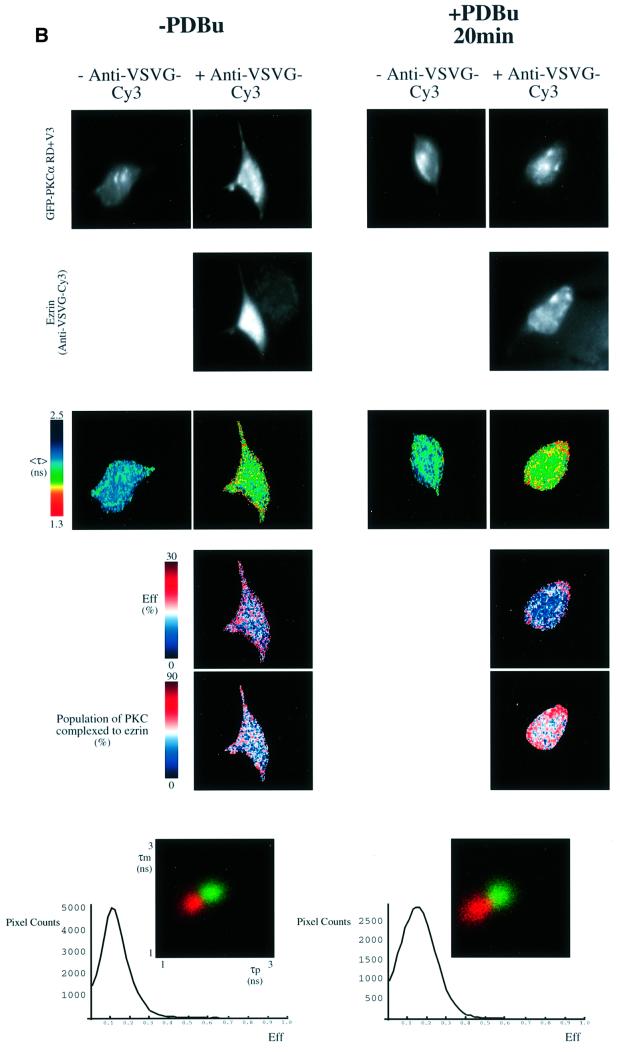
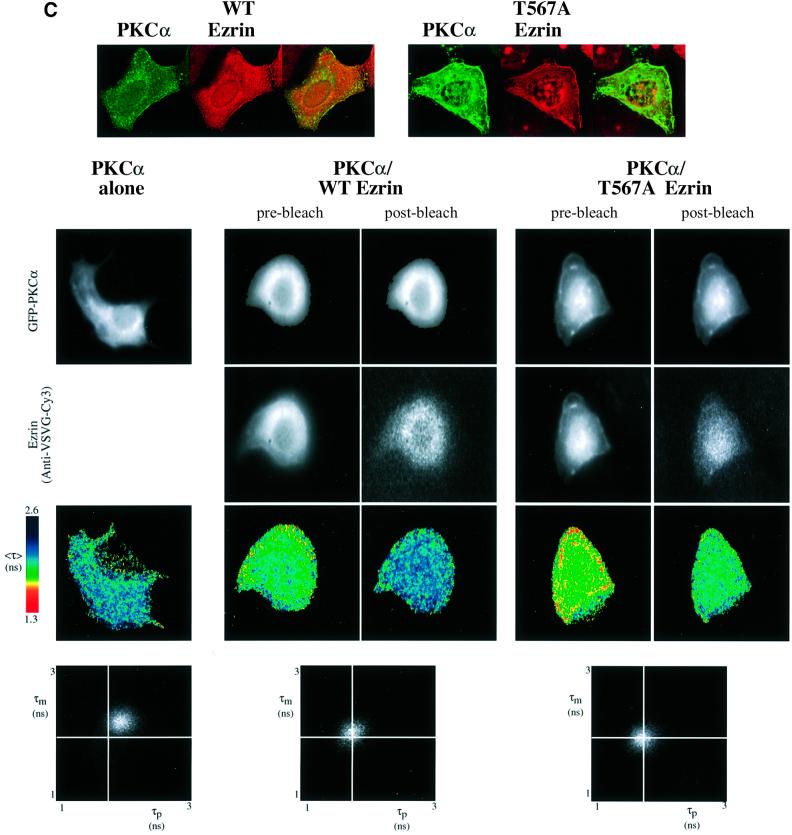
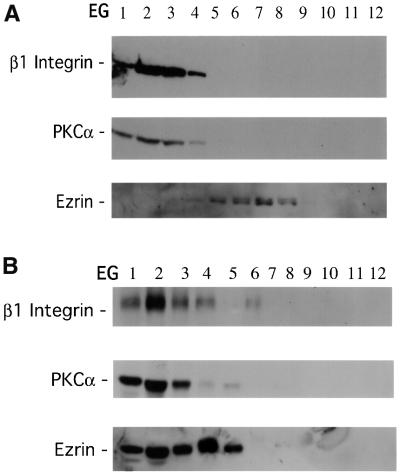
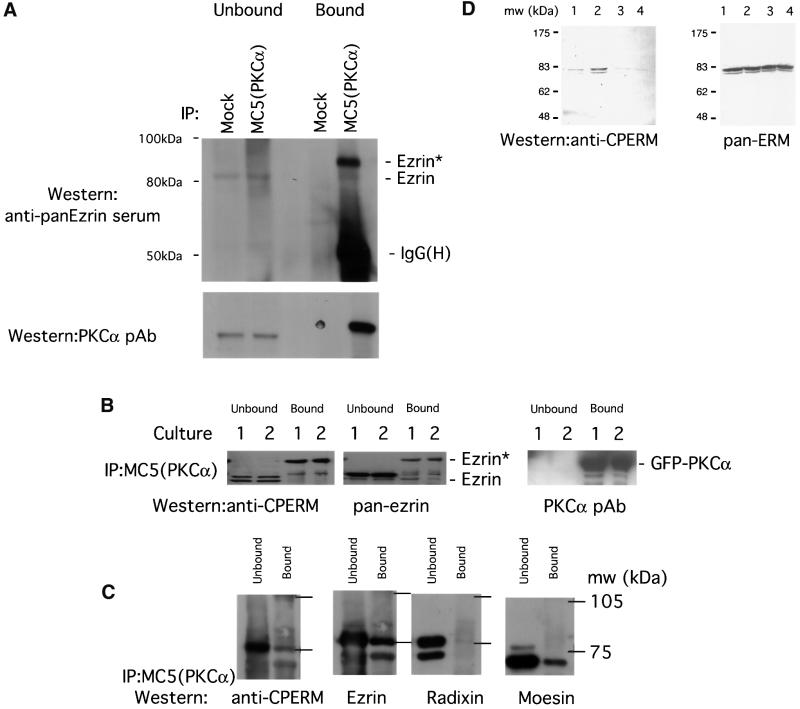
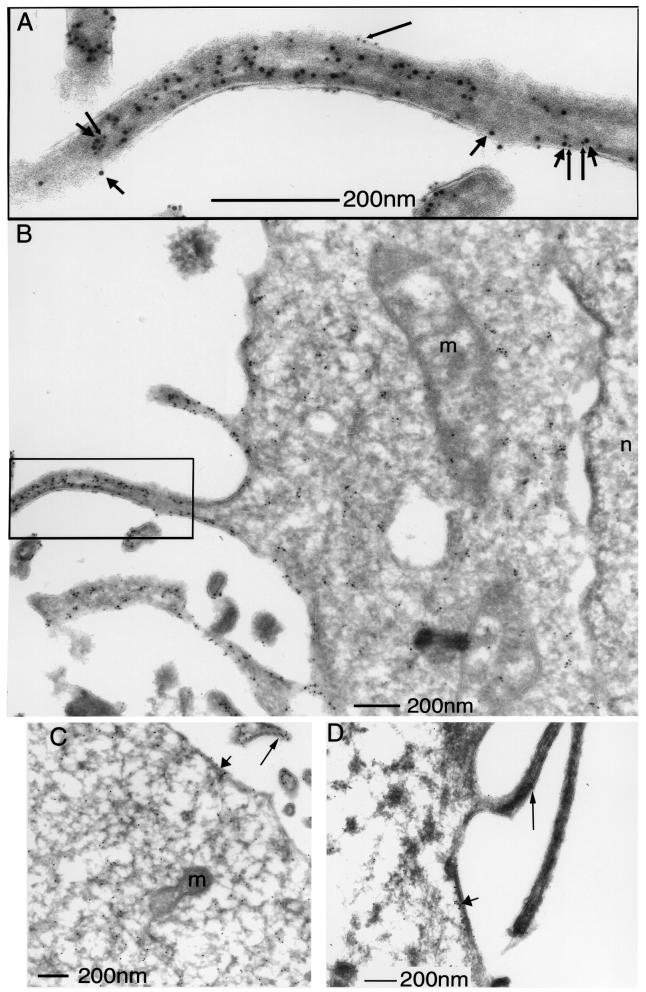
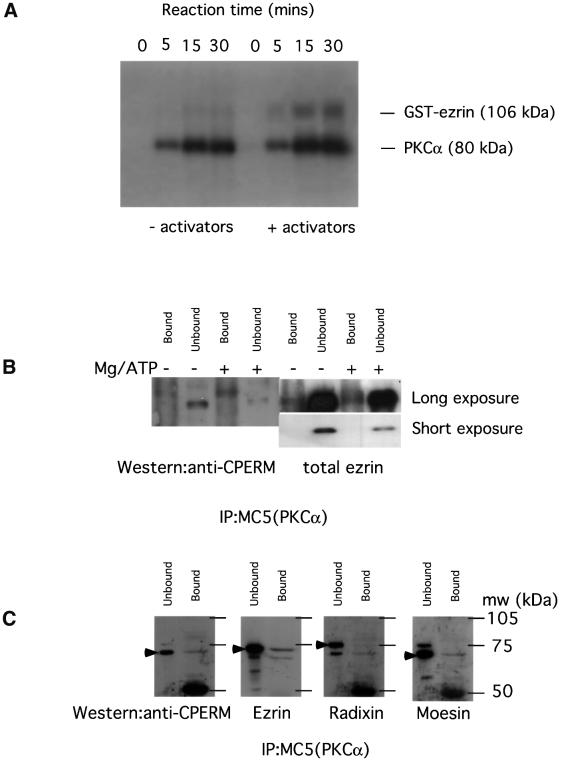
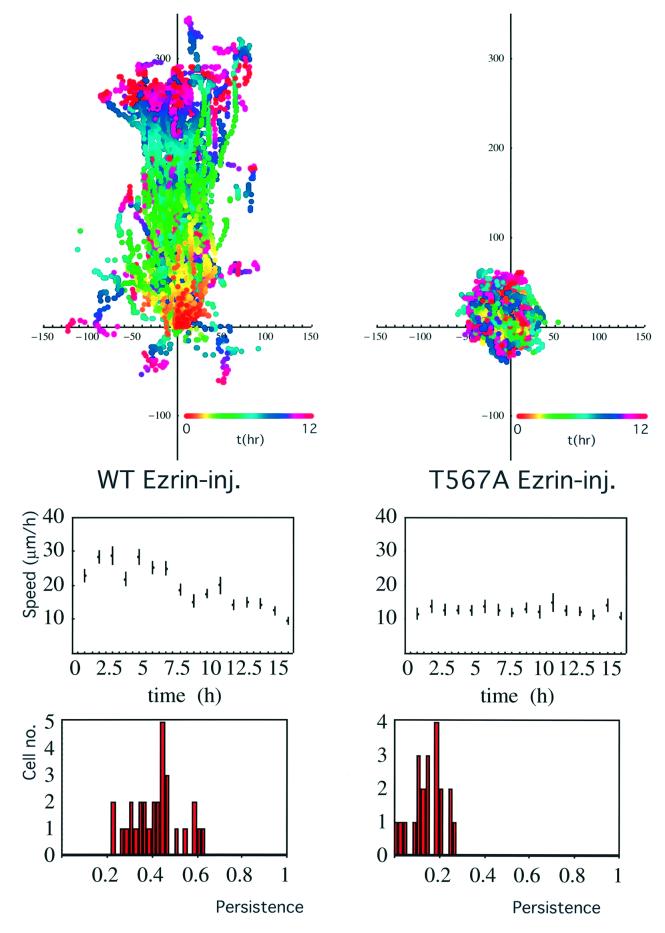
Protein kinase C (PKC) alpha has been implicated in beta1 integrin-mediated cell migration. Stable expression of PKCalpha is shown here to enhance wound closure. This PKC-driven migratory response directly correlates with increased C-terminal threonine phosphorylation of ezrin/moesin/radixin (ERM) at the wound edge. Both the wound migratory response and ERM phosphorylation are dependent upon the catalytic function of PKC and are susceptible to inhibition by phosphatidylinositol 3-kinase blockade. Upon phorbol 12,13-dibutyrate stimulation, green fluorescent protein-PKCalpha and beta1 integrins co-sediment with ERM proteins in low-density sucrose gradient fractions that are enriched in transferrin receptors. Using fluorescence lifetime imaging microscopy, PKCalpha is shown to form a molecular complex with ezrin, and the PKC-co-precipitated endogenous ERM is hyperphosphorylated at the C-terminal threonine residue, i.e. activated. Electron microscopy showed an enrichment of both proteins in plasma membrane protrusions. Finally, overexpression of the C-terminal threonine phosphorylation site mutant of ezrin has a dominant inhibitory effect on PKCalpha-induced cell migration. We provide the first evidence that PKCalpha or a PKCalpha-associated serine/threonine kinase can phosphorylate the ERM C-terminal threonine residue within a kinase-ezrin molecular complex in vivo.


Figures

None
Fig. 1. PKC-driven wound closure response in 2C4 fibrosarcoma cells stably transfected with GFP–PKCα. (A) Confluent 2C4 fibrosarcoma cells stably transfected with GFP–PKCα (GFP–PKCα-2C4) or the GFP control vector were wounded and the wound closure response was recorded by time-lapse microscopy. Part I: the total level of PKCα, as detected by a PKCα C-terminal polyclonal antibody, in two different batches of the GFP–PKCα-2C4 cell line (1) and (2), in comparison with that in the vector control cell line. Loading control was provided by stripping the blot and reprobing with an anti-β-actin mAb. In both GFP–PKCα-2C4 lanes, both the exogenous GFP-tagged and untagged forms of PKCα are apparent, with the latter possibly representing a cleavage product of the expressed protein. Overall, the ratio of the levels of PKCα expressed in GFP–PKCα-2C4 versus the GFP control vector line was 3:1. In both parts II and III, the upper panels show all the cell trajectories during the entire time course of each experiment. Each dot represents a cell position at a particular time point that is indicated by the pseudocolour scale (t in h) beneath each set of cell tracks. The scale of the cell track axes is in µm. Middle panels show the changes in mean speed (of all tracked cells ± SD) with time, and the lower panels show the distribution of persistence within the cell populations in each treatment group. Speed and persistence were derived from the analysis of tracked cells from at least four independent experiments (except for the +Y-27632 data where n = 2) as described in Materials and methods. Persistence of motility measured for each cell was calculated as the ratio of the resultant displacement in 16 h over the sum of individual 5 min displacements. GFP–PKCα-2C4 cells (GFP–PKCα) (n = 75, mean persistence = 0.63 ± 0.2) showed a significant increase in persistence of migration into a wound space overnight (P <0.01) when compared with 2C4 cells stably expressing GFP control vector (GFP vector) (n = 48, mean persistence = 0.08 ± 0.03). In cultures wounded in the presence of 10 µM BIM (GFP–PKCα + BIM) (n = 66, mean persistence = 0.14 ± 0.1) or LY294002 (10 µM) (GFP–PKCα + LY294002) (n = 46, mean persistence = 0.15 ± 0.14), there was a loss of cell persistence. The Rho kinase (ROCK) inhibitor Y-27632 (GFP–PKCα + Y27632) (n = 40, mean persistence = 0.53 ± 0.1) had no effect on the persistence of migration compared with untreated cultures. (B) GFP–PKCα-2C4 cells were wounded after a 30 min incubation in media containing LY294002 (10 µM) (+LY294002) (n = 26, mean persistence = 0.79 ± 0.09). PDBu (1 µM) was added to the media after wounding and the wound closure response was monitored. Results from two independent experiments were analysed. The P-value for the difference between the LY294002-treated group and the no pre-treatment control (WT PKCα + PDBu) (n = 25, mean persistence = 0.79 ± 0.09) was derived using ANOVA.
None
Fig. 2. PKC control of ERM C-terminal threonine phosphorylation in response to wounding. Confluent MCF-10A cells or 2C4 fibrosarcoma cells stably expressing GFP–PKCα (GFP–PKCα-2C4) were wounded and ERM C-terminal threonine phosphorylation (CPERM) was detected by confocal microscopy using an anti-CPERM mAb 297S as described in Materials and methods. Each image represents a two-dimensional projection of 2–3 slices in the Z-series, taken across the mid-depth of the cell at 0.2 µm intervals. Left: in wounded MCF-10A cells, endogenous PKCα was stained with mAb MC5 and its partial co-localization with anti-CPERM staining was shown. Representative scale bar = 10 µm. Right: GFP–PKCα-2C4 cells were pre-treated for 1 h and incubated with the following compounds for 4 h after wounding, before fixation: BIM (10 µM), LY294002 (10 µM) and ROCK inhibitor Y-27632 (10 µM). Representative scale bar = 20 µm. In both cell types, there was an increase in ERM C-terminal threonine phosphorylation (anti-CPERM) at the wound edge compared with the confluent region of the monolayer. The effects of the various inhibitors are shown.
None
Fig. 3. PKC–ezrin association in MCF-7 cells detected by FLIM. (A) MCF-7 cells were dually transfected with both a GFP–PKCα- and a VSVG-tagged ezrin construct. After 36 h, cells were stimulated with PDBu (1 µM) for the times indicated, then fixed in ice-cold methanol for 4 min (–20°C). Cells were stained with a Cy3-labelled anti-VSVG mAb. FRET results in a shortening of the GFP (donor) fluorescence lifetime that is measured by two independent parameters, the phase shift (τp) and relative modulation depth (τm). The fluorescence images from the donor (GFP–PKCα) and acceptor (anti-VSVG-Cy3), the donor fluorescence lifetime <τ> (the average of τp and τm) and its corresponding pseudocolour scales are shown. Eff is the pixel-by-pixel FRET efficiency represented on a pseudocolour scale [Eff = 1 – τdad, where τda is the lifetime map of the donor in the presence of acceptor and τd is the average lifetime <τ> of the donor in the absence of acceptor (numerically taken as the average of mean <τ> of five GFP–PKC alone control cells at each time point)]. The cumulative lifetimes of GFP–PKCα alone (green) and that measured in the presence of the acceptor fluorophore (red) are plotted on the two-dimensional histograms in the lower panels (n = 5 for each time point). The pixel counts versus Eff (%) profile in the bottom panel summarizes all the FRET efficiency data at each time point. (B) Repeat experiment in which MCF-7 cells were co-transfected with GFP–PKCα RD + V3 and wild-type VSVG–ezrin and stimulated with PDBu for 20 min before fixation. n = 7 for PDBu treatment and no treatment control. For cumulative analysis, in addition to the pixel counts versus Eff (%) profiles in the lowest panel, quantitative maps of the populations of both the ezrin-bound and unbound forms of GFP–PKCα RD + V3 were derived using a global FLIM analysis, and two representative pseudocolour cell plots are presented as ‘percentage population of PKC complexed to ezrin’. (C) Repeat experiment in which MCF-7 cells were co-transfected with GFP–PKCα and either wild-type (WT) or T567A ezrin and stimulated with PDBu for 20 min before fixation. The confocal images in the upper panels are two-dimensional projections of 2–3 slices in the Z-series, taken across the mid-depth of the cell at 0.2 µm intervals, illustrating the similarity in terms of cell morphology and the degree of PKC/ezrin co-localization between WT and T567A ezrin-co-transfected cells. n = 4 for transfection with GFP–PKCα alone as well as for each PKC/ezrin co-transfection. Co-transfection with either WT or T567A ezrin and subsequent staining with the Cy3-labelled anti-VSVG antibody resulted in lifetime shortening (compared with GFP–PKCα alone controls), which was partially reversed after 4 min bleaching of the Cy3 acceptor as shown by the <τ> pseudocolor maps of the cells. The fluorescence images from the donor (GFP–PKCα) and acceptor (anti-VSVG-Cy3), before and after partial bleaching, are shown. Pre-bleach, before Cy3 acceptor photobleaching; post-bleach, after 4 min of photobleaching. The two-dimensional histograms represent the cumulative lifetimes.
None
Fig. 4. Co-sedimentation of GFP–PKCα, β1 integrin and ezrin in sucrose gradient fractions derived from PDBu-activated MCF-7 cells. (A) PKCα and β1 integrin (recognized by mAbs MC5 and 8E3, respectively) were found in a light vesicle pool (fractions 2–3) from unstimulated, GFP–PKCα-transfected MCF-7 cell post-nuclear supernatant fractionated by velocity sucrose gradient (VG) centrifugation as described in Materials and methods (data not shown). Equilibrium gradient (EG) fractions were derived from this light vesicle pool (VG fractions 2–3) of unstimulated MCF-7 cell post-nuclear supernatant. EG fractions 1–4 were enriched in both GFP–PKCα and β1 integrin. There was a partial overlap with the EG fractions (4–8) containing endogenous ezrin. (B) The same as (A), with the exception that GFP–PKCα-transfected MCF-7 cells were stimulated with 1 µM PDBu for 10 min prior to fractionation. PKCα and β1 integrin were found to co-sediment in a light vesicle pool (fractions 2–3) from PDBu-stimulated, GFP–PKCα-transfected MCF-7 cell post-nuclear supernatant fractionated by VG centrifugation (data not shown). EG fractions were derived from these VGs. EG fractions 1–4 were enriched in GFP–PKCα and β1 integrin, as well as endogenous ezrin. Among the post-PDBu EG fractions, endogenous transferrin receptors were only detected in fractions 1–4 (data not shown).
None
Fig. 5. Association of endogenous ERM proteins with PKCα in vivo correlated with an increase in C-terminal threonine phosphorylation. (A) MDA-MB-231 cells stimulated with PDBu. Co-precipitation of endogenous PKCα (immunoprecipitated with an anti-PKCα mAb MC5) with endogenous ezrin detected by an anti-ezrin rabbit serum. All the bound proteins on the protein G beads (bound) and 1/30 of the unbound proteins left in the cell extract supernatant after the first centrifugation post-precipitation (unbound) were loaded. Ezrin* is a subset of ezrin that exhibits a slower electrophoretic mobility and is only detected in the PKCα-bound ezrin pool. The blot was stripped and reprobed with an anti-PKCα pAb. Mock, control immunoprecipitation in which the precipitating antibody was omitted; IgG(H), immunoglobulin heavy chain. Approximate positions of the molecular weight markers are shown. (B) GFP–PKCα-2C4 cells stimulated with PDBu. Co-precipitation of GFP–PKCα with endogenous ezrin. All the bound proteins on the protein G beads (bound) and 1/100 of the unbound proteins left in the cell extract supernatant after the first centrifugation post-precipitation (unbound) were loaded. The blot containing MC5 immunoprecipitates, derived from two independent experiments (cultures 1 and 2), was detected first with a polyclonal rabbit anti-CPERM IgG, stripped and reprobed with an anti-ezrin rabbit serum, then stripped and reprobed again with an anti-PKCα pAb. (C) Relative proportion of total ERM bound to GFP–PKCα in unstimulated GFP–PKCα-2C4 cells. MC5 immuno precipitates from three untreated cultures were pooled and one-third of the pooled bound proteins on the protein G beads (bound) were loaded. Similarly, 1/300 of the pooled unbound proteins left in the cell extract supernatant after the first centrifugation post-precipitation (unbound) were loaded. The blot was cut into three strips and stained with (i) an affinity-purified polyclonal rabbit anti-CPERM IgG and crude sera raised against radixin (ii) and moesin (iii), respectively. The anti-CPERM blot (i) was then stripped and reprobed with an affinity-purified anti-ezrin IgG that has been cross-adsorbed for moesin and radixin. (D) In total LLC-PK1 cell lysates, immunoreactivity of ERM proteins with the affinity-purified polyclonal rabbit anti-CPERM IgG was abolished by pre-treatment of cells with staurosporine (a broad spectrum protein kinase inhibitor) before cell lysis, and enhanced by calyculin A, a protein serine/threonine phosphatase 1 (PP1)/PP2A inhibitor. ERM, immunoblot developed with a mixture of antibodies specific for ERM (Gautreau et al., 2000). Lane 1, untreated; lane 2, treated with calyculin A (100 nM, 10 min); lanes 3 and 4, treated with 1 and 5 µM staurosporine, respectively, for 10 min. Approximate positions of the molecular weight markers are shown.
None
Fig. 6. Enrichment of GFP–PKCα and ezrin at plasma membrane protrusions. (A and B) The main immunoelectron micrograph (B) shows the localization of both VSVG-tagged ezrin (detected by an affinity-purified rabbit anti-ezrin IgG + 10 nm protein A–gold; short arrows) and GFP–PKCα (detected by a rabbit anti-GFP antiserum + 5 nm protein A–gold; long arrows). The inset (A) represents an enlarged view of a plasma membrane protrusion showing isolated and clusters of the 5 and 10 nm protein A–gold labels. m = mitochondrium, n = nucleus. (C and D) The immuno localization of wild-type and T567A, VSVG-tagged ezrin in GFP–PKCα-2C4 cells, respectively (stained with an anti-VSVG mAb P5D4 + 10 nm protein A–gold). The long and short arrows show the localization of ezrin in the plasma membrane protrusion and a peripheral (cortical) area of the cell, respectively.
None
Fig. 7. In vitro phosphorylation of ezrin by PKCα. (AIn vitro phosphorylation of a GST–wild-type ezrin (106 kDa) with human recombinant PKCα was carried out as described in Materials and methods. The time courses of the autophosphorylation of PKCα and TPA/lipids/Ca2+ (activators)-induced, PKC-mediated ezrin phosphorylation (representative of >3 experiments) are shown. (B) GFP–PKCα was immunoprecipitated with an anti-PKCα mAb MC5 from whole-cell lysates of 80% confluent GFP–PKCα-2C4 cell monolayer cultures that were pre-treated for 6 h with LY294002 (10 µM). One-hundredth of the unbound proteins left in the cell extract supernatant after the first centrifugation post-precipitation were loaded in the lanes marked ‘unbound’. The protein G beads were washed at 4°C, post-precipitation, twice with the modified RIPA buffer, then twice with 70 µl of a 0.05 M HEPES/0.5 mM EGTA buffer containing a cocktail of protease inhibitors, calyculin A (10 nM) and sodium orthovanadate (1 mM). In the +Mg/ATP lane, this was exchanged for an equivalent buffer containing in addition 12.5 mM MgCl2 and 0.1 mM ATP. The beads were then incubated at 30°C for 30 min in a shaking heating block. The phosphorylation reaction was stopped by centrifugation in a cooling microcentrifuge (4°C) and by adding 70 µl of modified Laemmli’s sample buffer (containing final concentrations of 2% SDS, 4 M urea and 10 mM EDTA) to the beads post-centrifugation. All the bound proteins on the protein G beads were loaded in the lanes marked ‘bound’. Western blotting with the polyclonal rabbit anti-CPERM IgG showed an ∼300% increase in the amount of CPERM in the PKC-co-precipitated material on beads after the ex vivo phosphorylation reaction. The amount of ezrin on beads (total ezrin) in the – Mg/ATP or +Mg/ATP lane was similar. The ratio of the ‘bound:unbound total ezrin’ was, however, notably lower in the LY294002-treated cultures (<0.2 in both the – Mg/ATP and +Mg/ATP lanes) compared with untreated cultures (mean ± SEM = 0.6 ± 0.08; Figure 5 and data not shown). A shorter exposure of the pan-ezrin blot shows that the amount of total ezrin in the ‘unbound’ fraction of the +Mg/ATP lane was slightly lower than that of the –Mg/ATP lane but these were derived from different cultures. (C) Repeat of the PKCα immunoprecipitation experiment with GFP–PKCα-2C4 cells that had been pre-treated with LY294002 (10 µM for 6 h) to reduce the basal ERM C-terminal threonine phosphorylation before lysis. One-hundredth of the unbound proteins left in the cell extract supernatant after the first centrifugation post-precipitation were loaded in the lanes marked ‘unbound’. The protein G beads were washed at 4°C, post-precipitation, twice with the modified RIPA buffer, then once with a 10 mM Tris pH 7.4 buffer containing a cocktail of protease and phosphatase inhibitors before elution with 70 µl of Laemmli’s sample buffer. All the bound proteins on the protein G beads were loaded in the lanes marked ‘bound’. The blot was probed with an anti-CPERM IgG, then stripped and reprobed with an affinity-purified anti-ezrin IgG that had been cross-adsorbed for moesin and radixin, followed by anti-radixin and anti-moesin detection, respectively, with the appropriate rabbit sera. The major band of reactivity in each blot is indicated by a filled arrowhead. The approximate positions of molecular weight markers are shown and, after sufficient exposure times, a 50 kDa band appeared and corresponds to the immunoglobulin heavy chain.
None
Fig. 8. Dominant inhibitory effect of the T567A ezrin variant on the PKCα-induced wound migratory response. A wild-type or T567A VSVG-tagged ezrin plasmid (100 µg/ml) was microinjected into the nuclei of confluent GFP–PKCα-2C4 cells along with a Cy3-conjugated anti-transferrin receptor antibody as a marker to identify the injected cells subsequently. The monolayer was wounded and the migration response was recorded by time-lapse microscopy. Upper panels: all the cell trajectories during the entire time course of each experiment. Each dot represents a cell position at a particular time point that is indicated by the pseudocolour scale (t in h) beneath each set of cell tracks. The scale of the cell track axes is in µm. Left, wild-type ezrin-injected cell (WT Ezrin-inj.); right, a representative T567A ezrin-injected cell (T567A Ezrin-inj.). Middle panel: the changes in mean speed with time. Lower panel: the distribution of persistence within the cell populations in each treatment group. Speed and persistence were derived from the analysis of tracked cells from three independent experiments (total number of cells tracked = 30 for WT Ezrin-inj. and 21 for T567A Ezrin-inj.). The mean persistences = 0.42 ± 0.1 (SD) and 0.15 ± 0.07 (SD) for the WT Ezrin-inj. and T567A Ezrin-inj. cultures, respectively. The P-value for the difference between the two treatment groups was derived using ANOVA.

References

    1. Algrain M., Turunen,O., Vaheri,A., Louvard,D. and Arpin,M. (1993) Ezrin contains cytoskeleton and membrane binding domains accounting for its proposed role as a membrane–cytoskeletal linker. J. Cell Biol., 120, 129–139. - PMC - PubMed
    1. Arber S., Barbayannis,F.A., Hanser,H., Schneider,C., Stanyon,C.A., Bernard,O. and Caroni,P. (1998) Regulation of actin dynamics through phosphorylation of cofilin by LIM-kinase. Nature, 393, 805–809. - PubMed
    1. Bae Y.S., Cantley,L.G., Chen,C.S., Kim,S.R., Kwon,K.S. and Rhee,S.G. (1998) Activation of phospholipase C-γ by phosphatidylinositol 3,4,5-trisphosphate. J. Biol. Chem., 273, 4465–4469. - PubMed
    1. Bastiaens P.I.H. and Jovin,T.M. (1998) Fluorescence resonance energy transfer microscopy. In Celis,J. (ed.), Cell Biology: A Laboratory Handbook. Academic Press, New York, NY, pp. 136–146.
    1. Berrier A.L., Mastrangelo,A.M., Downward,J., Ginsberg,M. and LaFlamme,S.E. (2000) Activated R-Ras, Rac1, PI 3-kinase and PKCε can each restore cell spreading inhibited by isolated integrin β1 cytoplasmic domains. J. Cell Biol., 151, 1549–1560. - PMC - PubMed

Publication types

MeSH terms