. 2001 Jun 1;533(Pt 2):341-55.
doi: 10.1111/j.1469-7793.2001.0341a.x.

Novel voltage-dependent non-selective cation conductance in murine colonic myocytes

Affiliations

Novel voltage-dependent non-selective cation conductance in murine colonic myocytes

S D Koh et al. J Physiol. .

Abstract

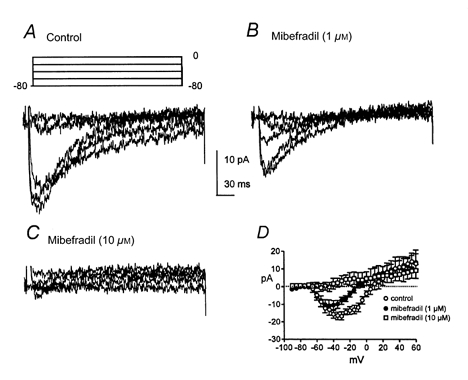
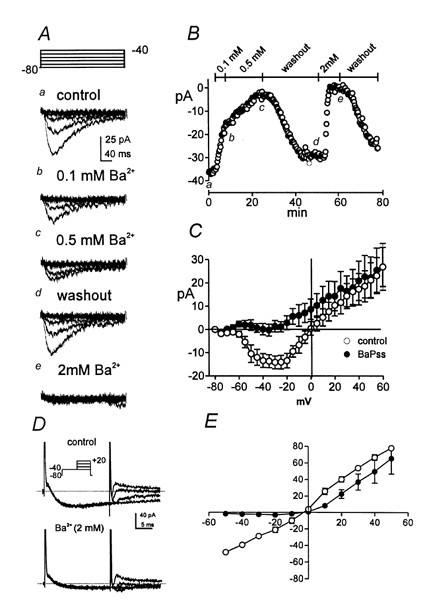
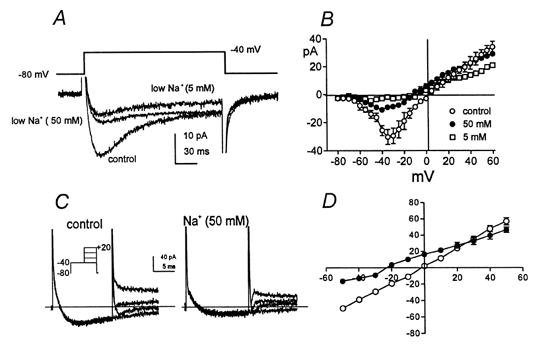
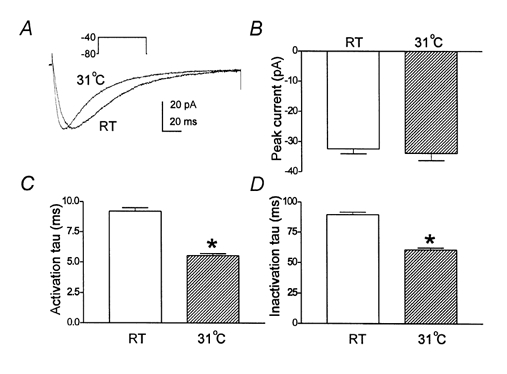
1. Two components of voltage-gated, inward currents were observed from murine colonic myocytes. One component had properties of L-type Ca(2+) currents and was inhibited by nicardipine (5 x 10(-7) M). A second component did not 'run down' during dialysis and was resistant to nicardipine (up to 10(-6) M). The nicardipine-insensitive current was activated by small depolarizations above the holding potential and reversed near 0 mV. 2. This low-voltage-activated current (I(LVA)) was resolved with step depolarizations positive to -60 mV, and the current rapidly inactivated upon sustained depolarization. The voltage of half-inactivation was -65 mV. Inactivation and activation time constants at -45 mV were 86 and 15 ms, respectively. The half-recovery time from inactivation was 98 ms at -45 mV. I(LVA) peaked at -40 mV and the current reversed at 0 mV. 3. I(LVA) was inhibited by Ni(2+) (IC(50) = 1.4 x 10(-5) M), mibefradil (10(-6) to 10(-5) M), and extracellular Ba(2+). Replacement of extracellular Na(+) with N-methyl-D-glucamine inhibited I(LVA) and shifted the reversal potential to -7 mV. Increasing extracellular Ca(2+) (5 x 10(-3) M) increased the amplitude of I(LVA) and shifted the reversal potential to +22 mV. I(LVA) was also blocked by extracellular Cs(+) (10(-4) M) and Gd(3+) (10(-6) M). 4. Warming increased the rates of activation and deactivation without affecting the amplitude of the peak current. 5. We conclude that the second component of voltage-dependent inward current in murine colonic myocytes is not a 'T-type' Ca(2+) current but rather a novel, voltage-gated non-selective cation current. Activation of this current could be important in the recovery of membrane potential following inhibitory junction potentials in gastrointestinal smooth muscle or in mediating responses to agonists.


Figures

Figure 1
Figure 1. Isolation of ILVA and IHVA by voltage protocols
A, representative currents elicited by test potentials from -50 to +25 mV (in 15 mV increments; Vh= -50 mV). B, representative currents elicited by test potentials from -90 to -15 mV (in 15 mV increments; Vh= -80 mV). C, current-voltage relationship for currents obtained from holding potentials of -80 mV (○), -50 mV (•) and difference currents (▪). D, representative currents were recorded with conventional whole-cell voltage clamp in response to depolarizing steps to -50, -35 and -15 mV from two different holding potentials of -50 mV (•) and -80 mV (○). The inset (voltage protocol) shows examples of currents in response to selected test potentials (V1). E, difference currents at each test potential were obtained by subtracting currents obtained from two holding potentials.
Figure 2
Figure 2. Isolation of ILVA and IHVA by nicardipine
A, current responses to test potentials from -80 to -15 mV (5 mV increments) in control solutions were recorded (Vh= -80 mV). B, current responses recorded using the same protocol as in A in the presence of nicardipine (0.5 μm). C, average current-voltage relationship in control (○) and in the presence of 0.01 (•) and 1 μm (□) nicardipine. D, effects of nicardipine concentration on responses elicited by steps to -35 mV (○) and -15 mV (•) (n = 7 cells; Vh= -80 mV). * Significant differences.
Figure 3
Figure 3. Measurement of reversal potential of ILVA using instantaneous tail current analysis
A, membrane currents elicited by a two-pulse protocol in which a cell was stepped from -80 to -40 mV and then from -80 to 0 mV. Repetitive stepping was performed during the application of nicardipine (1.0 μm). Nicardipine had no effect on the current elicited by steps to -40 mV (ILVA) and totally blocked the current elicited by steps to 0 mV (IHVA). B, a second voltage-clamp protocol applied to the same cell after addition of nicardipine. The cell was held at -80 mV, stepped to -40 mV for 10 ms to activate ILVA, and then stepped to potentials ranging from -50 to +40 mV (selected current responses are shown). C, summary of current-voltage data using the same protocols in experiments on 11 cells. ILVA reversed at -4.7 mV.
Figure 4
Figure 4. Voltage dependence of inactivation of ILVA and IHVA
A, currents generated by inactivation protocol to isolate ILVA. Membrane potential was stepped to conditioning potentials between -90 and -35 mV (5 mV increments) for 300 ms from a holding potential of -80 mV, and then stepped to a test potential of -40 mV in the presence of 0.5 μm nicardipine. B, currents generated by inactivation protocols to isolate IHVA. Membrane potential was stepped to conditioning pulses between -80 and +20 mV from a holding potential of -50 mV for 1.2 s and then stepped to a test potential of 0 mV in the absence of nicardipine. C, the voltage dependences of inactivation of ILVA (○) and IHVA (•) are shown as a plot of normalized peak inward currents during the test steps as a function of conditioning potentials. The half-inactivation potentials (denoted by dotted lines) were determined from Boltzmann functions fitted to the data (continuous lines) (n = 6 cells).
Figure 5
Figure 5. Kinetics of activation and inactivation of ILVA
A, membrane currents were elicited by test potentials from -60 to -40 mV for 250 ms. These responses were followed by returning voltage to the holding potential (-80 mV) for various periods (50 ms to 450 ms). Then cells were returned to the test potential for 300 ms to determine the rate of recovery from inactivation (all tests performed in the presence of nicardipine; 0.5 μm). B, summary of experiments describing recovery from inactivation (n = 4 cells). Normalized peak currents at -40 mV using the protocol described in A were plotted as a function of the interval between test depolarizations. The continuous line shows a fit of the data with the equation It/Imax= 1 - (1/Imax) exp (-t/τ), where It is the amplitude of the current after t ms of recovery, Imax is the amplitude of the fully recovered current, and t and τ are time and the time constant in milliseconds. C, membrane current recorded after a step to -40 mV. The activation and inactivation portions of the currents (dots) were well fitted by single exponentials (continuous lines).
Figure 7
Figure 7. Inhibition of ILVA by mibefradil
A, representative currents elicited by test potentials from -80 to 0 mV (in 20 mV increments; Vh= -80 mV) in the presence of nicardipine (0.5 μm). B and C, currents elicited in the same cell using the same protocol after addition of mibefradil (1 and 10 μm). D, current-voltage relationships for peak currents in control (○), 1 (•) and 10 μm (□) mibefradil (n = 4).
Figure 6
Figure 6. Inhibition of ILVA by Ni2+
A, representative currents in response to test potentials from -40 to -10 mV (in 10 mV increments; Vh= -80 mV) in the presence of nicardipine (0.5 μm). A, control currents. B-D, currents in the presence of Ni2+ (5, 10 and 30 μm as indicated). E, the current-voltage relationships for peak currents recorded in control (○) and in solutions containing 5 (•), 10 (□), 30 μm (▪) Ni2+. F, inhibitory effects of Ni2+ concentration on currents elicited at -40 mV. The IC50 was determined from a sigmoidal function fitted to the data (continuous line). n = 7 cells.
Figure 8
Figure 8. Effects of external Ca2+ on ILVA
A, representative currents elicited by test potentials from -80 to -40 mV (in 10 mV increments; Vh= -80 mV) in the presence of nicardipine (0.5 μm) and 2 mm external Ca2+. B, currents elicited in the same cells using the same protocol after removal of external Ca2+ (nominally 0 Ca2+); and C, in the presence of elevated external Ca2+ (5 mm). D, current-voltage relationship for peak currents in 2 (○), 0 (▪) and 5 mm (•) Ca2+ (n = 6 cells). The dotted line in D denotes shift in reversal potential when external Ca2+ was 5 mm. E, representative currents elicited by instantaneous current-voltage protocol at -40, -20, +20 and +40 mV (see inset) in the presence of nicardipine (1 μm). The continuous line denotes zero current level. F, current-voltage relationship by tail current analysis in 2 mm (○) and 0.5 mm (•) Ca2+ (n = 4 cells).
Figure 9
Figure 9. Effects of external Ba2+ on ILVA
A, representative currents elicited test potentials from -80 to -40 mV (in 10 mV increments; Vh= -80 mV) in the presence of nicardipine (0.5 μm): Aa, control currents. Ab-Ae, effects of various concentrations of Ba2+ on ILVA in the presence of 2.0 mm Ca2+. B, effects of Ba2+ on peak current amplitude of ILVA in response to repetitive steps to -40 mV every 10 s (a-e in B denote the times when currents in A were recorded). The bar at the top shows changes in solutions during the time course of this experiment. C, current-voltage relationship in 2 mm Ca2+ (○) and when external Ca2+ was replaced with equimolar (2 mm) Ba2+ (n = 5 cells). D, representative currents elicited by instantaneous current-voltage protocol from -40 to 20 mV (in 20 mV increments, see inset for protocol) in the presence of nicardipine (1 μm). The continuous line denotes zero current level. E, current-voltage relationship by tail current analysis in control (○) and 2 mm (•) Ba2+ (n = 4 cells).
Figure 10
Figure 10. Effects of external Na+ replacement on ILVA
A, representative currents in response to test potentials of -40 mV in the presence of nicardipine (0.5 μm; Vh= -80 mV). Three currents recorded from the same cell are superimposed in which external Na+ was 135 mm (control), 50 mm and 5 mm. Na+ was replaced with equimolar NMDG. B, current-voltage relationship for peak currents elicited in 135 mm Na+ (○), 50 mm Na+ (•), and 5 mm Na+ (□) (n = 6). C, representative currents elicited by instantaneous current-voltage protocol from -40 to 20 mV (in 20 mV increments, see inset for protocol) in the presence of nicardipine (1 μm). The continuous line denotes zero current level. D, current-voltage relationship by tail current analysis in control (○) and 50 mm (•) Na+ (n = 5 cells).
Figure 11
Figure 11. Effects of external Cs+ and Gd3+ on ILVA
A, currents elicited by a test potential of -40 mV in the presence of nicardipine (0.5 μm). Superimposed currents are before and after addition of 0.2 mm Cs+. B, current-voltage relationship showing currents in control (○), 0.1 (•) and 0.2 mm (□) Cs+. C, current-voltage relationship for the Cs+-sensitive (0.2 mm) current. D and E, representative currents elicited by instantaneous current-voltage protocol from -40 to 20 mV (in 20 mV increments, see inset for protocol) in control and in the presence of Cs+ (1 mm), respectively. The continuous line denotes zero current level. F, current-voltage relationship by tail current analysis in control (○) and 1 mm (•) Cs+ (n = 4 cells). G, currents elicited by a test potential of -40 mV in the presence of nicardipine (0.5 μm). Superimposed currents are before and after addition of 2 μm Gd3+. H, current-voltage relationship showing currents in control (○) and 2 μm Gd3+ (•). I, current-voltage relationship for the Gd3+-sensitive current.
Figure 12
Figure 12. Effects of temperature on ILVA
A, ILVA elicited in the same cell by steps from -80 to -40 mV at room temperature (RT) and 31°C. The currents are averages of currents elicited by 16 steps. The activation and inactivation of ILVA were increased by warming. Note there was little or no change in the amplitude of the peak current as a function of temperature. BD, summary of the comparisons of peak current (B), activation (C) and inactivation (D) time constants for four cells studied with the same protocol.
Figure 13
Figure 13. RT-PCR: a representative ethidium bromide-stained agarose gel of RT-PCR products
PCR products were generated by using degenerate primers, forward primer TCaF1 and reverse primer TCaR2 for the low-voltage-activated T-type Ca2+ channel gene from the cDNAs of the brain tissues and colonic myocytes of mice. The second PCR was performed through the use of the nested primers, forward primer TCaF2 and reverse primer TCaR1. Products, 1009 bp and 750 bp, were readily detected at the first PCR in brain. Product of a 904 bp fragment was detected at the second PCR in brain, but not in colonic myocytes. A 497 bp product amplified from the β-actin gene was used for endogenous control and NTC was a non-template control. A 100 bp marker on each side indicated the size of the fragments.

Similar articles

Cited by

References

    1. Bezprozvanny I, Tsien RW. Molecular Pharmacology. Vol. 48. 1995. Voltage-dependent blockade of diverse types of voltage-gated Ca2+ channels expressed in Xenopus oocytes by the Ca2+ channel antagonist mibefradil (Ro 40-5967) pp. 540–549. - PubMed
    1. Brixius K, Mohr V, Muller-Ehmsen J, Hoischen S, Munch G, Schwinger RH. Potent vasodilatory with minor cardiodepressant actions of mibefradil in human cardiac tissue. British Journal of Pharmacology. 1998;125:41–48. - PMC - PubMed
    1. Crist JR, He XD, Goyal RK. Chloride-mediated inhibitory junction potentials in opossum esophageal circular smooth muscle. American Journal of Physiology. 1991;261:G752–762. - PubMed
    1. Denyer JC, Brown HF. Pacemaking in rabbit isolated sino-atrial node cells during Cs+ block of the hyperpolarization-activated current if. Journal of Physiology. 1990;429:401–409. - PMC - PubMed
    1. Ertel SI, Ertel EA. Low-voltage-activated T-type Ca2+ channels. Trends in Pharmacological Sciences. 1997;18:37–42. - PubMed

Publication types

MeSH terms

LinkOut - more resources