. 2001 Jun 1;533(Pt 2):367-77.
doi: 10.1111/j.1469-7793.2001.0367a.x.

Excitation-contraction coupling in skeletal muscle of a mouse lacking the dihydropyridine receptor subunit gamma1

Affiliations

Excitation-contraction coupling in skeletal muscle of a mouse lacking the dihydropyridine receptor subunit gamma1

D Ursu et al. J Physiol. .

Abstract

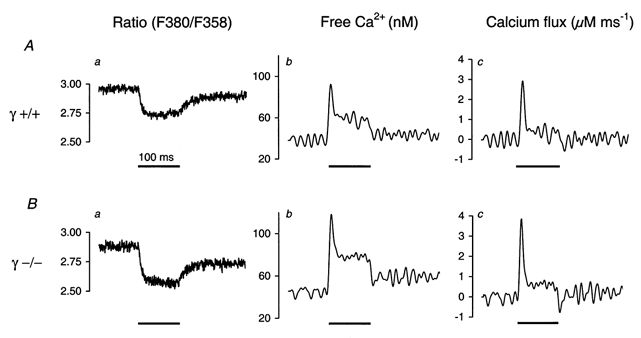
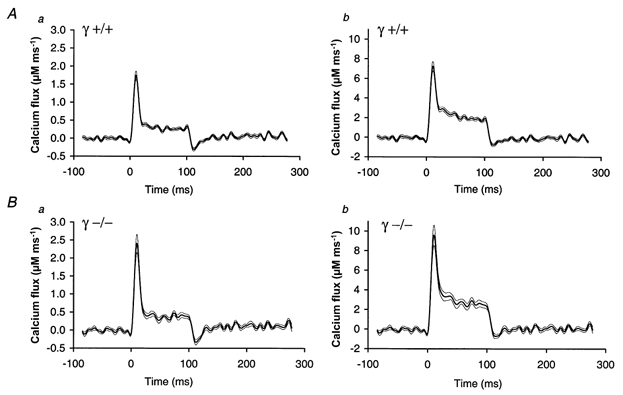
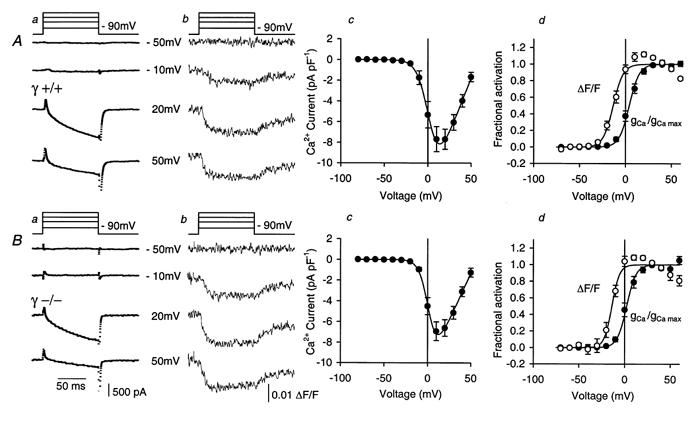
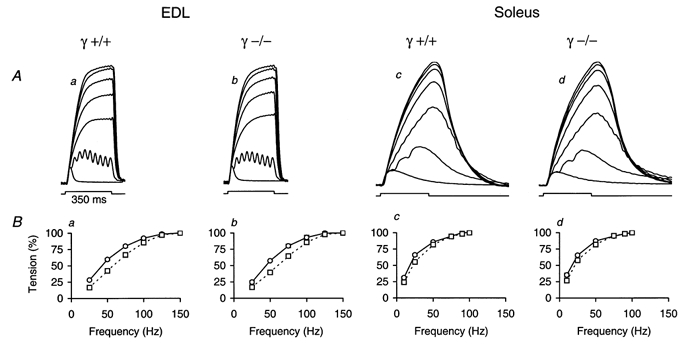
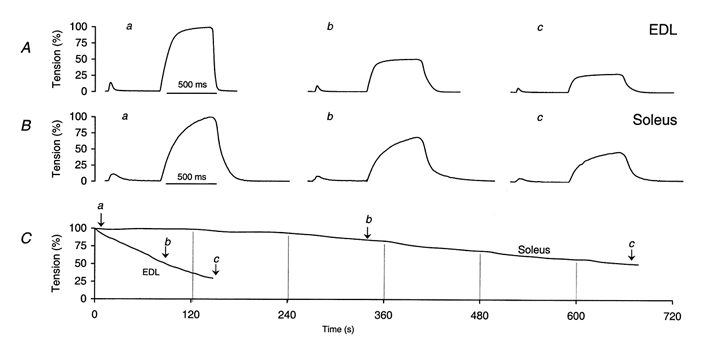
1. In skeletal muscle, dihydropyridine (DHP) receptors control both Ca(2+) entry (L-type current) and internal Ca(2+) release in a voltage-dependent manner. Here we investigated the question of whether elimination of the skeletal muscle-specific DHP receptor subunit gamma1 affects excitation-contraction (E-C) coupling. We studied intracellular Ca(2+) release and force production in muscle preparations of a mouse deficient in the gamma1 subunit (gamma-/-). 2. The rate of internal Ca(2+) release at large depolarization (+20 mV) was determined in voltage-clamped primary-cultured myotubes derived from satellite cells of adult mice by analysing fura-2 fluorescence signals and estimating the concentration of free and bound Ca(2+). On average, gamma-/- cells showed an increase in release of about one-third of the control value and no alterations in the time course. 3. Voltage of half-maximal activation (V(1/2)) and voltage sensitivity (k) were not significantly different in gamma-/- myotubes, either for internal Ca(2+) release activation or for the simultaneously measured L-type Ca(2+) conductance. The same was true for maximal Ca(2+) inward current and conductance. 4. Contractions evoked by electrical stimuli were recorded in isolated extensor digitorum longus (EDL; fast, glycolytic) and soleus (slow, oxidative) muscles under normal conditions and during fatigue induced by repetitive tetanic stimulation. Neither time course nor amplitudes of twitches and tetani nor force-frequency relations showed significant alterations in the gamma1-deficient muscles. 5. In conclusion, the overall results show that the gamma1 subunit is not essential for voltage-controlled Ca(2+) release and force production.


Figures

Figure 1
Figure 1. Estimating the time course of Ca2+ release in myotubes using fura-2 fluorescence transients
A, ratio F380/F358 of single fura-2 fluorescence signals obtained at a 100 ms depolarization to +20 mV (horizontal bar) in a γ+/+ myotube (a), calculated free Ca2+ after correction for the indicator time response (b) and Ca2+ input flux (c) (see Results and Methods). B, corresponding calculations for a γ–/– myotube.
Figure 2
Figure 2. Mean time course of the Ca2+ release rate in myotubes
Comparison of calculated Ca2+ release rate using the means of 23 measurements in γ+/+ myotubes (A) and 14 measurements in γ–/– myotubes (B). Release was activated by a 100 ms depolarization to +20 mV. For panels Aa and Ba, the parameters used in the calculation were the same as in Fig. 1. In panels Ab and Bb, the rate constants of EGTA were altered at constant KD to match more accurately the condition of zero release following repolarization to the holding potential. Thin lines indicate s.e.m. On average, the peak release rate in the γ–/– cells was about one-third higher than the value estimated for γ+/+: 2.41 ± 0.26 μm ms−1vs. 1.75 ± 0.12 μm ms−1 in a and 9.60 ± 1.00 μm ms−1vs. 7.27 ± 0.47 μm ms−1 in b. The release rate during the steady level (averaged over the last 10 ms of the pulse) was similarly different: 0.39 ± 0.06 μm ms−1vs. 0.25 ± 0.03 μm ms−1 in a and 2.51 ± 0.29 μm ms−1vs. 1.78 ± 0.12 μm ms−1 in b. These changes led to a corresponding fractional increase of the total Ca2+ released during the pulse (a, 31.2 %; b, 29.7 %). Free Ca2+ values immediately before the pulses derived from the resting fluorescence ratios were 49 ± 10 nm in γ+/+ and 72 ± 14 nm in γ–/–. They were not significantly different (P = 0.15).
Figure 3
Figure 3. Voltage dependence of L-type Ca2+ conductance and Ca2+ release in myotubes
A, typical Ca2+ inward currents (a) and fluorescence transients (ΔF/F) (b) at different voltages, mean current-voltage relation (c) and normalized activation curves (d) of Ca2+ conductance (•) and Ca2+ release (○) in 14 experiments on γ+/+ myotubes. Best-fit parameter values of individual fits by eqn (1) and (2): gCa,max= 211 ± 22 pS pF−1, VCa= 59 ± 2 mV, V1/2= 4.11 ± 1.84 mV, k = 5.44 ± 0.26 mV. Fluorescence: V1/2= -12.72 ± 1.70 mV, k = 4.91 ± 0.36 mV. The curves were drawn using these parameter values. B, corresponding data to A of individual measurements (a and b) and mean values (c and d) of 8 experiments on γ–/– myotubes. Best-fit parameters: gCa,max= 180 ± 21 pS pF−1, VCa= 57 ± 2 mV, V1/2= 2.15 ± 2.10 mV, k = 5.10 ± 0.52 mV. Fluorescence: V1/2= -13.56 ± 2.91 mV, k = 4.04 ± 0.53 mV. Maximal inward current, maximal inward current density and voltage of maximal inward current were not significantly different: 1.06 ± 0.16 nA, 8.28 ± 1.18 pA pF−1 and 14.3 ± 1.6 mV, respectively, in the γ+/+ group vs. 1.14 ± 0.20 nA, 7.00 ± 0.84 pA pF−1 and 11.9 ± 2.0 mV, respectively, in the γ–/– group. Similarly, cell capacitance, series resistance, gleak and Vleak showed no significant difference: 133 ± 18 pF, 5.83 ± 0.43 MΩ, 17.32 ± 5.87 pS pF−1 and 20.4 ± 4.1 mV, respectively, for γ+/+vs. 149 ± 14 pF, 6.86 ± 1.23 MΩ, 17.65 ± 4.17 pS pF−1 and 14.4 ± 2.81 mV, respectively, for γ–/–.
Figure 4
Figure 4. Contractile activation in fast and slow twitch muscles
A, single twitches and contractions measured at different stimulation frequencies in EDL (a and b) and soleus muscle (c and d). Example recordings of γ+/+ (a and c) and γ–/– muscles (b and d) are shown. The rectangular signal below the traces shows the time interval of 350 ms in which repetitive stimulation was activated. Frequencies of 25, 50, 75, 100, 125 and 150 Hz were applied in EDL and of 10, 25, 50, 75, 90 and 100 Hz in soleus. The signals were normalized to the maximum. The maximal force values were 141 mN (a), 194 mN (b), 101 mN (c) and 74 mN (d). B, force-frequency relations derived from recordings similar to those shown in A. The normalized mean force values at the end of the stimulation period are plotted. In both γ+/+ and γ–/–, experiments were carried out on 4 EDL (a and b) and 3 soleus (c and d) muscles. The error bars indicating s.e.m. are smaller than the symbol sizes. ○, measured before fatigue; □, measured after stimulation leading to fatigue (tetanus amplitude 30 % of original value in EDL and 50 % in soleus, see Fig. 5) and a subsequent 30 min recovery interval. The mean values of the frequency that generated half-maximal force (F1/2) were 42.47 ± 1.01 Hz (γ+/+, n = 4) vs. 44.31 ± 0.71 Hz (γ–/–, n = 4) for EDL and 18.17 ± 0.73 Hz (γ+/+, n = 3) vs. 17.21 ± 1.19 Hz (γ–/–, n = 3) for soleus. After fatigue and 30 min recovery the corresponding values were 57.90 ± 1.89 Hz (γ+/+) vs. 60.29 ± 2.08 Hz (γ–/–) for EDL and 22.50 ± 0.79 Hz (γ+/+) vs. 21.39 ± 1.79 Hz (γ–/–) for soleus.
Figure 5
Figure 5. Fatigue in fast and slow twitch muscle
Examples of twitch and tetanus recordings in EDL (A) and soleus (B) at different times during fatigue stimulation (see text for details). C, amplitude change of tetanic contraction in EDL and soleus plotted against time to exemplify fatigue runs. a, b and c indicate the times when the signals shown in A and B were recorded. Vertical lines indicate times when the tetanus repetition rate was increased (see text for details).

References

    1. Baylor SM, Chandler WK, Marshall MW. Sarcoplasmic reticulum calcium release in frog skeletal muscle fibres estimated from Arsenazo III calcium transients. Journal of Physiology. 1983;344:625–666. - PMC - PubMed
    1. Baylor SM, Hollingworth S. Model of sarcomeric Ca2+ movements, including ATP Ca2+ binding and diffusion, during activation of frog skeletal muscle. Journal of General Physiology. 1998;112:297–316. - PMC - PubMed
    1. Beam KG, Knudson CM, Powell JA. A lethal mutation in mice eliminates the slow calcium current in skeletal muscle cells. Nature. 1986;320:168–170. - PubMed
    1. Bosse E, Regulla S, Biel M, Ruth P, Meyer HE, Flockerzi V, Hofmann F. The cDNA and deduced amino acid sequence of the gamma subunit of the L-type calcium channel from rabbit skeletal muscle. FEBS Letters. 1990;267:153–156. - PubMed
    1. Brum G, Rios E, Stefani E. Effects of extracellular calcium on calcium movements of excitation-contraction coupling in frog skeletal muscle fibres. Journal of Physiology. 1988;398:441–473. - PMC - PubMed

Publication types

MeSH terms

LinkOut - more resources