

Dopamine D(2)-like receptors selectively block N-type Ca(2+) channels to reduce GABA release onto rat striatal cholinergic interneurones
- PMID: 11389206
- PMCID: PMC2278623
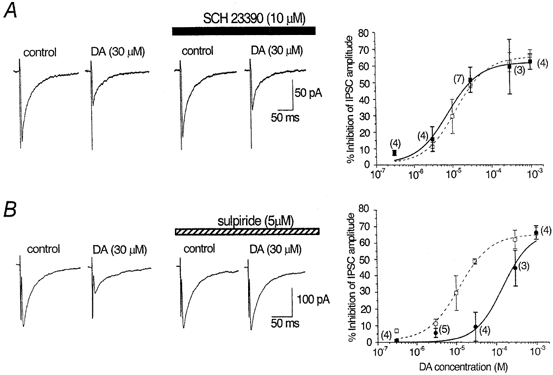
- DOI: 10.1111/j.1469-7793.2001.0479a.x
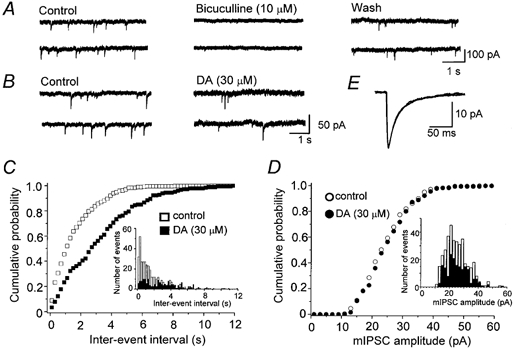
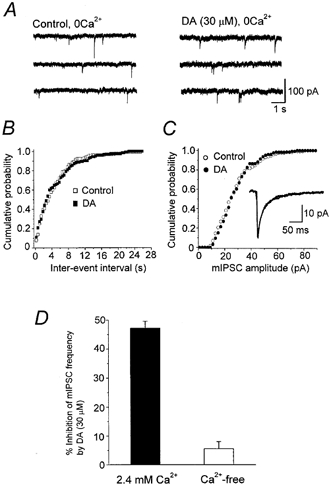
Dopamine D(2)-like receptors selectively block N-type Ca(2+) channels to reduce GABA release onto rat striatal cholinergic interneurones
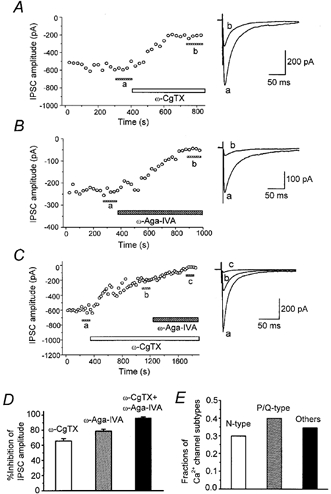
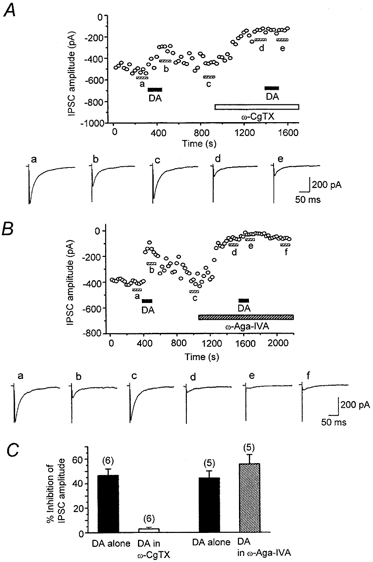
Abstract
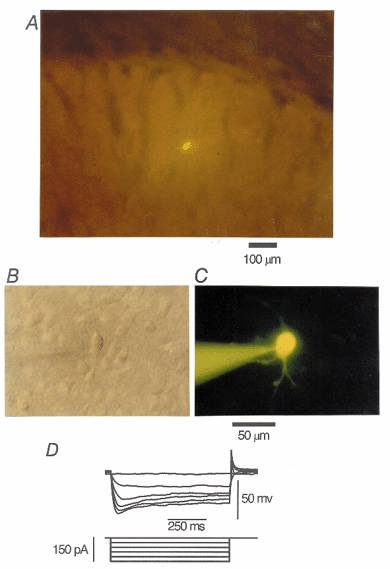
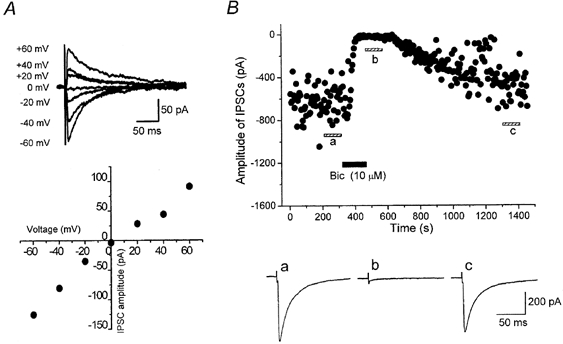
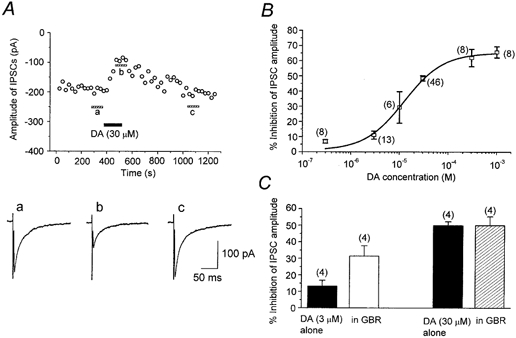
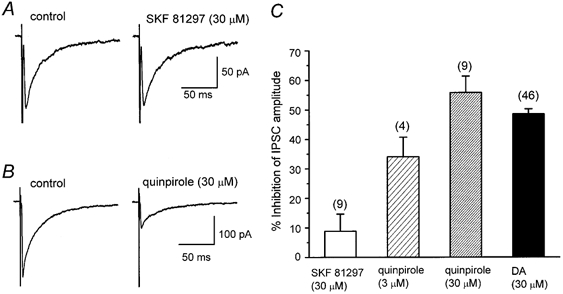
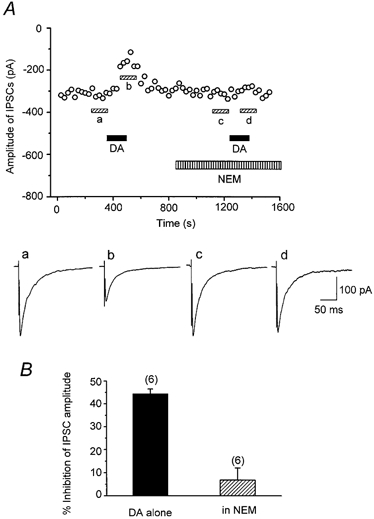
1. The modulatory roles of dopamine (DA) in inhibitory transmission onto striatal large cholinergic interneurones were investigated in rat brain slices using patch-clamp recording. 2. Pharmacologically isolated GABA(A) receptor-mediated IPSCs were recorded by focal stimulation within the striatum. Bath application of DA reversibly suppressed the amplitude of evoked IPSCs in a concentration-dependent manner (IC(50), 10.0 microM). 3. A D(2)-like receptor agonist, quinpirole (3-30 microM), also suppressed the IPSCs, whereas a D(1)-like receptor agonist, SKF 81297, did not affect IPSCs. Sulpiride, a D(2)-like receptor antagonist, blocked the DA-induced suppression of IPSCs (apparent dissociation constant (K(B)), 0.36 microM), while a D(1)-like receptor antagonist, SCH 23390 (10 microM), had no effect. 4. DA (30 microM) reduced the frequency of spontaneous miniature IPSCs (mIPSCs) without changing their amplitude distribution, suggesting that GABA release was inhibited, whereas the sensitivity of postsynaptic GABA(A) receptors was not affected. The effect of DA on the frequency of mIPSCs was diminished when extracellular Ca(2+) was replaced by Mg(2+) (5 mM), indicating that DA affected the Ca(2+) entry into the presynaptic terminal. 5. An N-type Ca(2+) channel selective blocker, omega-conotoxin GVIA (omega-CgTX, 3 microM), suppressed IPSCs by 65.4 %, whereas a P/Q-type Ca(2+) channel selective blocker, omega-agatoxin IVA (omega-Aga-IVA, 200 nM), suppressed IPSCs by 78.4 %. Simultaneous application of both blockers suppressed IPSCs by 95.9 %. Assuming a 3rd power relationship between Ca(2+) concentration and transmitter release, the contribution of N-, P/Q- and other types of Ca(2+) channels to presynaptic Ca(2+) entry is estimated to be, respectively, 29.8, 40.0 and 34.5 % at this synapse. After the application of omega-CgTX, DA (30 microM) no longer affected IPSCs. In contrast, omega-Aga-IVA did not alter the level of suppression by DA, suggesting that the action of DA was selective for N-type Ca(2+) channels. 6. A G protein alkylating agent, N-ethylmaleimide (NEM), significantly reduced the DA-induced suppression of IPSCs. 7. These results suggest that presynaptic D(2)-like receptors are present on the terminals of GABAergic afferents to striatal cholinergic interneurones, and down-regulate GABA release by selectively blocking N-type Ca(2+) channels through NEM-sensitive G proteins.
Figures
Similar articles
-
Parallel decrease in omega-conotoxin-sensitive transmission and dopamine-induced inhibition at the striatal synapse of developing rats.J Physiol. 2003 Jan 15;546(Pt 2):483-90. doi: 10.1113/jphysiol.2002.031773. J Physiol. 2003. PMID: 12527734 Free PMC article.
-
[Dopamine receptors and calcium channels regulating striatal inhibitory synaptic transmission].Nihon Yakurigaku Zasshi. 2002 Nov;120(1):61P-63P. Nihon Yakurigaku Zasshi. 2002. PMID: 12491781 Review. Japanese.
-
D1-like dopamine receptors selectively block P/Q-type calcium channels to reduce glutamate release onto cholinergic basal forebrain neurones of immature rats.J Physiol. 2007 Apr 1;580(Pt 1):103-17. doi: 10.1113/jphysiol.2006.125724. Epub 2007 Jan 18. J Physiol. 2007. PMID: 17234695 Free PMC article.
-
Serotonin 5-HT1B receptor-mediated calcium influx-independent presynaptic inhibition of GABA release onto rat basal forebrain cholinergic neurons.Eur J Neurosci. 2016 Jul;44(1):1747-60. doi: 10.1111/ejn.13273. Epub 2016 Jun 4. Eur J Neurosci. 2016. PMID: 27177433
-
[Calcium channel subtypes mediating central synaptic transmission].Nihon Yakurigaku Zasshi. 2002 Apr;119(4):235-40. doi: 10.1254/fpj.119.235. Nihon Yakurigaku Zasshi. 2002. PMID: 11979729 Review. Japanese.
Cited by
-
Short-term plasticity shapes activity pattern-dependent striato-pallidal synaptic transmission.J Neurophysiol. 2013 Feb;109(4):932-9. doi: 10.1152/jn.00459.2012. Epub 2012 Nov 28. J Neurophysiol. 2013. PMID: 23197459 Free PMC article.
-
Receptor subtypes involved in the presynaptic and postsynaptic actions of dopamine on striatal interneurons.J Neurosci. 2003 Jul 16;23(15):6245-54. doi: 10.1523/JNEUROSCI.23-15-06245.2003. J Neurosci. 2003. PMID: 12867509 Free PMC article.
-
Dopaminergic modulation of axon collaterals interconnecting spiny neurons of the rat striatum.J Neurosci. 2003 Oct 1;23(26):8931-40. doi: 10.1523/JNEUROSCI.23-26-08931.2003. J Neurosci. 2003. PMID: 14523095 Free PMC article.
-
Osteopetrosis and thalamic hypomyelinosis with synaptic degeneration in DAP12-deficient mice.J Clin Invest. 2003 Feb;111(3):323-32. doi: 10.1172/JCI16923. J Clin Invest. 2003. PMID: 12569157 Free PMC article.
-
Dopamine-mediated calcium channel regulation in synaptic suppression in L. stagnalis interneurons.Channels (Austin). 2018 Jan 1;12(1):153-173. doi: 10.1080/19336950.2018.1457897. Channels (Austin). 2018. PMID: 29589519 Free PMC article.
References
-
- Aizman O, Brismar H, UhlÉn P, Zettergren E, Levey AI, Forssberg H, Greengard P, Aperia A. Anatomical and physiological evidence for D1 and D2 dopamine receptor colocalization in neostriatal neurons. Nature Neuroscience. 2000;3:226–230. - PubMed
Publication types
MeSH terms
Substances
LinkOut - more resources
Full Text Sources
Other Literature Sources
Miscellaneous