

Muscle and joint elastic properties during elbow flexion in Duchenne muscular dystrophy
- PMID: 11389216
- PMCID: PMC2278635
- DOI: 10.1111/j.1469-7793.2001.0605a.x
Muscle and joint elastic properties during elbow flexion in Duchenne muscular dystrophy
Abstract
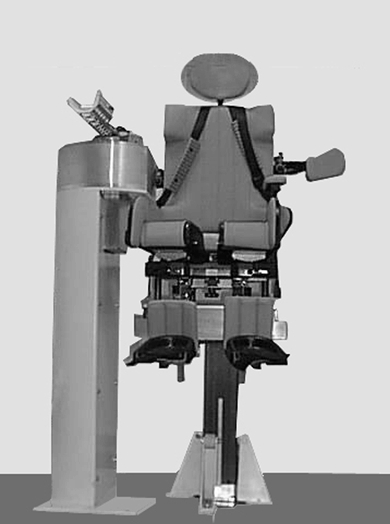
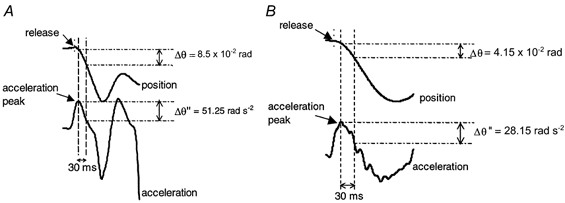
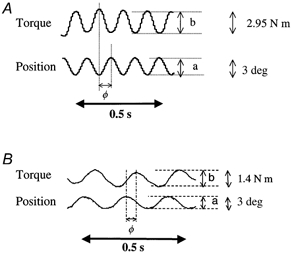
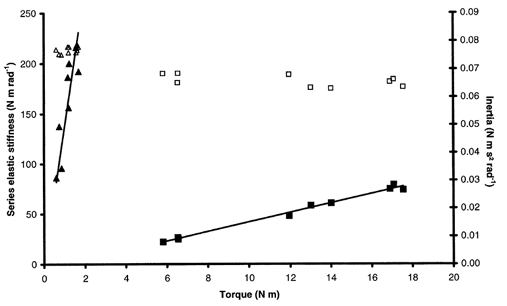
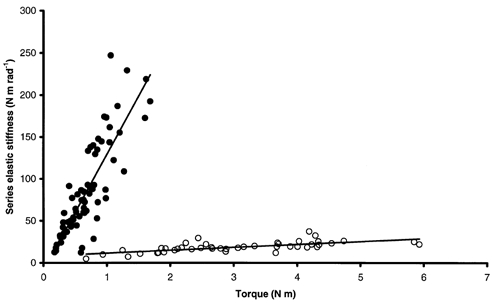
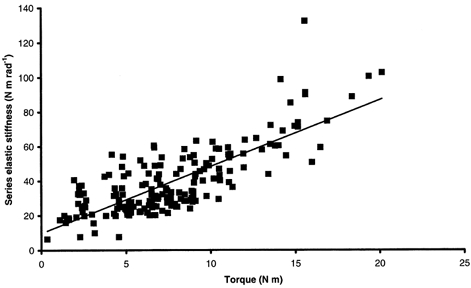
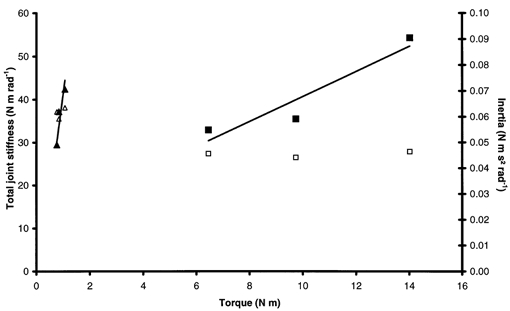
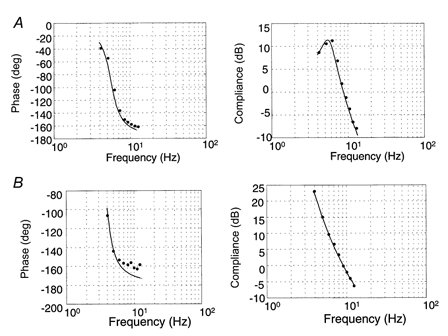
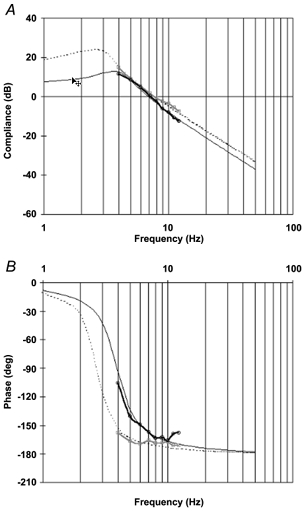
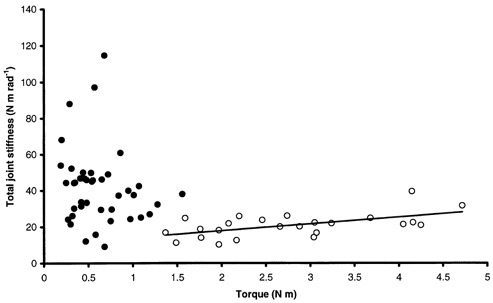
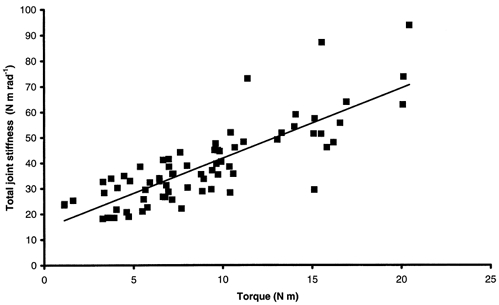
1. Maximal voluntary contraction (MVC), series elastic stiffness and total joint stiffness during elbow flexion were investigated in healthy boys and in boys with Duchenne muscular dystrophy (DMD) in order to assess changes in mechanical properties induced by the disease. 2. Two methods were used to perform stiffness measurements: (i) the application of sinusoidal perturbations to the joint during flexion efforts, allowing the calculation of total joint stiffness; (ii) the use of quick-release movements of the elbow, which had previously been maintained in isometric contraction, allowing the calculation of series elastic stiffness. In each case, stiffness was linearly related to torque, leading to the calculation of a normalized stiffness index as the slope of this stiffness-torque relationship. 3. As expected, mean MVC was found to be much higher for healthy boys (20.02 +/- 5.20 N m) than for DMD patients (3.09 +/- 2.44 N m). Furthermore, the results showed that it was possible to characterize healthy and DMD children by virtue of the mechanical properties measured. Mean series elastic stiffness index was higher for DMD children (142.55 +/- 136.58 rad(-1)) than for healthy subjects (4.39 +/- 2.53 rad(-1)). The same holds for mean total joint stiffness index: 43.68 +/- 67.58 rad(-1) for DMD children and 2.26 +/- 0.70 rad(-1) for healthy subjects. In addition, increases in stiffness were more marked in DMD patients exhibiting high levels of muscle weakness. 4. These changes are interpreted in terms of the adaptation of the properties of the muscles and joint involved, i.e. muscle fibres, tendons, peri- and intra-articular structures.
Figures
Similar articles
-
Musculo-tendinous and joint elastic characteristics during elbow flexion in children.Clin Biomech (Bristol). 2001 Nov;16(9):758-64. doi: 10.1016/s0268-0033(01)00076-6. Clin Biomech (Bristol). 2001. PMID: 11714553
-
Don't forget the trunk in Duchenne muscular dystrophy patients: more muscle weakness and compensation than expected.J Neuroeng Rehabil. 2019 Mar 27;16(1):44. doi: 10.1186/s12984-019-0515-y. J Neuroeng Rehabil. 2019. PMID: 30917845 Free PMC article.
-
Torques generated at the human elbow joint in response to constant position errors imposed during voluntary movements.Exp Brain Res. 1993;95(3):488-98. doi: 10.1007/BF00227142. Exp Brain Res. 1993. PMID: 8224075
-
Effects of Duchenne muscular dystrophy on muscle stiffness and response to electrically-induced muscle contraction: A 12-month follow-up.Neuromuscul Disord. 2017 Mar;27(3):214-220. doi: 10.1016/j.nmd.2017.01.001. Epub 2017 Jan 6. Neuromuscul Disord. 2017. PMID: 28161094
-
Review of upper extremity passive joint impedance identification in people with Duchenne Muscular Dystrophy.J Neuroeng Rehabil. 2025 Jan 25;22(1):13. doi: 10.1186/s12984-024-01537-0. J Neuroeng Rehabil. 2025. PMID: 39863905 Free PMC article. Review.
Cited by
-
Translocation of molecular chaperones to the titin springs is common in skeletal myopathy patients and affects sarcomere function.Acta Neuropathol Commun. 2017 Sep 15;5(1):72. doi: 10.1186/s40478-017-0474-0. Acta Neuropathol Commun. 2017. PMID: 28915917 Free PMC article.
-
Truncated dystrophins reduce muscle stiffness in the extensor digitorum longus muscle of mdx mice.J Appl Physiol (1985). 2013 Feb 15;114(4):482-9. doi: 10.1152/japplphysiol.00866.2012. Epub 2012 Dec 6. J Appl Physiol (1985). 2013. PMID: 23221959 Free PMC article.
-
Variable rescue of microtubule and physiological phenotypes in mdx muscle expressing different miniaturized dystrophins.Hum Mol Genet. 2018 Jun 15;27(12):2090-2100. doi: 10.1093/hmg/ddy113. Hum Mol Genet. 2018. PMID: 29618008 Free PMC article.
-
Length and activation dependent variations in muscle shear wave speed.Physiol Meas. 2013 Jun;34(6):713-21. doi: 10.1088/0967-3334/34/6/713. Epub 2013 May 29. Physiol Meas. 2013. PMID: 23719230 Free PMC article. Clinical Trial.
-
Changes in muscle and joint elasticity following long-term strength training in old age.Eur J Appl Physiol. 2007 Jul;100(5):491-8. doi: 10.1007/s00421-006-0184-y. Epub 2006 May 10. Eur J Appl Physiol. 2007. PMID: 16685553 Clinical Trial.
References
-
- Aitkens S, Lord AF, Bernauer E. Relationship of manual muscle testing to objective strength measurements. Muscle and Nerve. 1989;12:173–177. - PubMed
-
- Almeida silvera MI, Pérot C, Pousson M, Goubel F. Effects of stretch-shortening cycle training on mechanical properties and fibre type transition in the rat soleus muscle. Pflügers Archiv. 1994;427:289–294. - PubMed
-
- Bell CD, Conen PE. Histopathologic changes in Duchenne muscular dystrophy. Journal of the Neurological Sciences. 1968;7:529–544. - PubMed
Publication types
MeSH terms
LinkOut - more resources
Full Text Sources
Research Materials