. 2001 Jun 1;15(11):1383-92.
doi: 10.1101/gad.901101.

TSC1 and TSC2 tumor suppressors antagonize insulin signaling in cell growth

Affiliations

TSC1 and TSC2 tumor suppressors antagonize insulin signaling in cell growth

X Gao et al. Genes Dev. .

Abstract

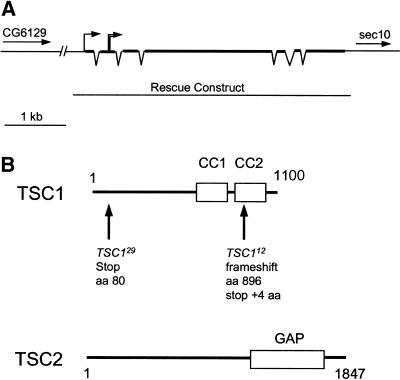
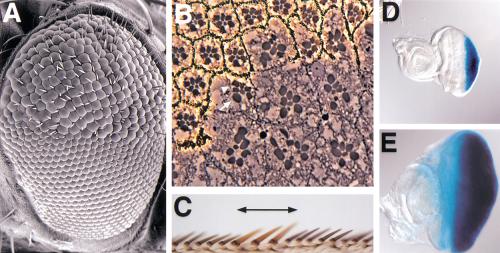
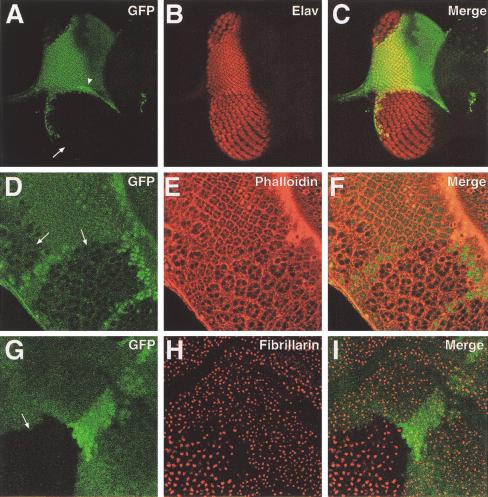
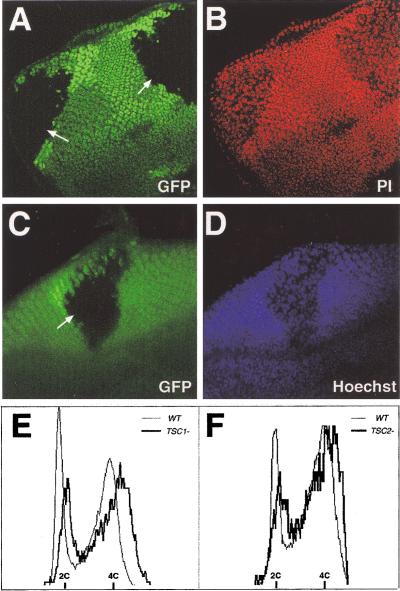
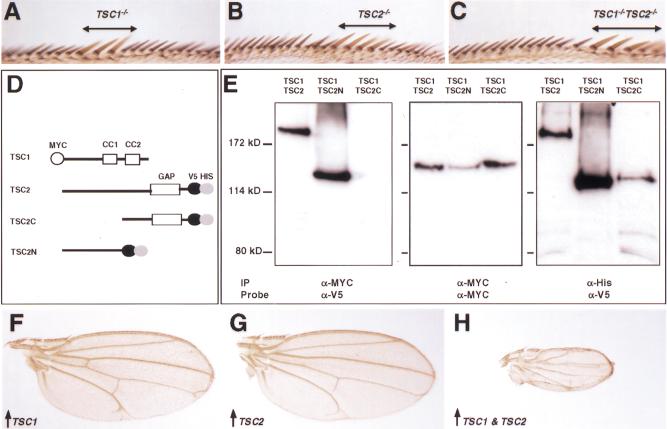
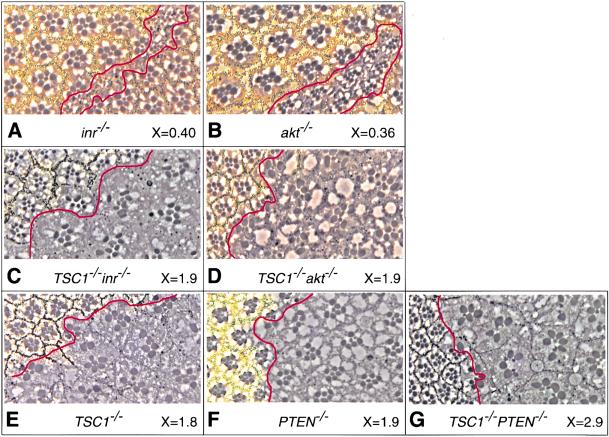
Tuberous sclerosis is a human disease caused by mutations in the TSC1 or the TSC2 tumor suppressor gene. Previous studies of a Drosophila TSC2 homolog suggested a role for the TSC genes in maintaining DNA content, with loss of TSC2 leading to polyploidy and increased cell size. We have isolated mutations in the Drosophila homolog of the TSC1 gene. We show that TSC1 and TSC2 form a complex and function in a common pathway to control cellular growth. Unlike previous studies, our work shows that TSC1(-) or TSC2(-) cells are diploid. We find that, strikingly, the heterozygosity of TSC1 or TSC2 is sufficient to rescue the lethality of loss-of-function insulin receptor mutants. Further genetic analyses suggest that the TSC genes act in a parallel pathway that converges on the insulin pathway downstream from Akt. Taken together, our studies identified the TSC tumor suppressors as novel negative regulators of insulin signaling.


Figures

Figure 1
Figure 1
Structure of the TSC1 locus and predicted structure of the TSC proteins. (A) Genomic structure of the TSC1 locus. The TSC1 gene is located between CG6129 and sec10 on 3R. The exons are indicated with thick lines and the introns are shown as thin lines connecting adjacent exons. The transcription start site is indicated with a single line with an arrow at the end. The translation start site is indicated with double lines with an arrow at the end. The genomic DNA fragment used in the rescue construct is indicated. (B) Schematic structures of the Drosophila TSC1 and TSC2 proteins. TSC1 is a predicted 1100 aa polypeptide containing two coiled-coil domains (CC1 and CC2). The molecular lesions in TSC112 and TSC129 are indicated. TSC2 is a predicted 1847 aa polypeptide containing a GAP domain.
Figure 2
Figure 2
TSC1 autonomously controls cell and organ size. (A) Scanning electron micrograph of a compound eye carrying a clone of homozygous TSC129 cells. The mutant clone occupies the upper half of the eye in the picture. Note that the TSC1 mutant ommatidia are larger than their wild-type counterparts. (B) Section through a TSC129 clone in the adult eye. The mutant clone is marked by the absence of pigment. The rhabdomeres of mutant photoreceptor cells are increased in area by about 80% compared with heterozygous photoreceptor cells (measured by Axiovision software). At the clone border, mosaic ommatidia containing normal-sized heterozygous cells (arrowhead) and enlarged homozygous TSC1 mutant cells (arrow) can be seen, indicating that TSC1 controls cell size autonomously. (C) Wing-margin bristles containing a TSC129 mutant clone. Note that the TSC1 mutant bristles (marked by y-, indicated by a line above the wing margin) are thicker and longer than the wild-type bristles, which have a dark color. (D–E) Images of a wild-type eye-antenna disc (D) and an eye-antenna disc in which TSC1 function was selectively removed in the eye by using the ey-Flp technique (E). The discs were also stained for glass-lacZ that is expressed in retinal cells. These images were taken under the same magnification. Note that the TSC1 eye disc is much larger than the wild-type disc.
Figure 3
Figure 3
TSC1 controls cellular growth and proliferation during imaginal disc development. In all panels, TSC1 mutant clones were generated by FRT/FLP and marked by the absence of Ubi-GFP signal (green). (A–C) Confocal images of a third-instar eye disc containing a large TSC1 clone (arrow). The adjacent area of brighter green staining represents a +/ + twin spot (arrowhead). The disc was stained for the neuronal specific nuclear Elav protein (red). Three images are shown, one of GFP (A), one of Elav staining (B), and one of superimposed GFP and Elav staining (C). Note the increased size of the mutant cell nuclei and the dramatically increased area of the mutant clone as compared with its twin spot. (D–F) Confocal images of a portion of a third-instar eye disc containing TSC1 mutant clones (arrows). The disc was stained with phalloidin (red), which highlights the outlines of the cells. Three images are shown, one of GFP (D), one of phalloidin staining (E), and one of superimposed GFP and phalloidin staining (F). Note the increased size of the mutant cells. (G–H) Confocal images of a portion of a third-instar wing disc containing a TSC1 mutant clone (arrow). The disc was stained with fibrillarin (red), which labels the nucleolus of the cells. Three images are shown, one of GFP (G), one of fibrillarin staining (H), and one of superimposed GFP and fibrillarin staining (H). Note the increased nucleolar size of the TSC1 cells.
Figure 4
Figure 4
TSC1 and TSC2 cells are diploid. In AD, mutant clones were generated by FRT/FLP and marked by the absence of Ubi-GFP signal (green). (A–B) Confocal images of a portion of a third-instar eye disc containing two TSC1 clones (arrows). The disc was stained with DNA dye propidium iodide (PI, shown in red). Two images are shown, one of GFP (A) and one of PI staining (B). Note that the intensity of PI staining is weaker in the mutant cells. Quantitation of Z series by using LSM 510 software showed that the total fluorescence in the nuclei is comparable between the mutant and the wild-type cell (data not shown). (C–D) Fluorescent light microscopy images of a portion of a third-instar eye disc containing a TSC2 (gigas) mutant clone (arrow). The disc was stained with DNA dye Hoechst 33342 (blue). Note that the intensity of Hoechst 33342 staining is weaker in the mutant cells. Quantitation by using the Axiovision software showed that the total fluorescence in the nuclei is comparable between the mutant and the wild-type cell (data not shown). (E–F) Flow cytometric analysis of dissociated wing imaginal discs containing TSC1 (E) and TSC2 (F) clones. The profiles of mutant and wild-type (WT) cells are indicated by heavy and light traces, respectively. No signal was detected beyond the DNA content of cycling diploid cells (data not shown). Note that the DNA content of TSC1 or TSC2 cells is similar to that of wild-type cells.
Figure 5
Figure 5
Interactions between TSC1 and TSC2. (A–C) Wing margins containing TSC1 (A), TSC2 (B), and TSC1 TSC2 (C) clones, respectively. Note that TSC single- or double-mutant bristles (marked by y, indicated by a line above the wing margin) are similar in size. (D) Schematic representation of epitope-tagged TSC1 and TSC2 proteins that were expressed in S2 cells. The TSC1 construct corresponds to the full-length protein and migrates as an ∼150-kD protein. Three TSC2 constructs were generated, including the full-length (TSC2, >200 kD), N-terminal half (TSC2N, ∼130 kD), and C-terminal half (TSC2C, ∼130 kD). (E) S2 cells expressing TSC1/TSC2, TSC1/TSC2N, and TSC1/TSC2C constructs were lysed and total cell lysate was immunoprecipitated (IP) with α-MYC and immunoblotted with α-V5 (left panel). TSC2 or TSC2N, but not TSC2C, can be immunoprecipitated with TSC1. The same blot was stripped and reprobed with α-MYC to show that TSC1 was expressed at comparable levels in all lanes (middle panel). As an additional control, TSC2, TSC2N, and TSC2C were precipitated from the same cell lysate by using Ni-NTA agarose (α-His) and probed with α-V5. These proteins were expressed at comparable levels (right panel). (F–H) Wings expressing MS1096/UAS-TSC1 (F), MS1096/UAS-TSC2 (G), and MS1096/UAS-TSC1; UAS-TSC2, respectively. These images were taken under the same magnification. Wings overexpressing both TSC1 and TSC2 are ∼28% the size of wings expressing TSC1 or TSC2 alone.
Figure 6
Figure 6
The TSC genes act in a parallel pathway that converges on the insulin pathway downstream from Akt. Eye sections of various mutant clones. The genotype of the mutant clone is labeled below each section, as well as the relative size of the mutant rhabdomeres as compared with the wild-type counterparts (X value). At least 50 ommatidia were measured in each genotype. Mutant clones were marked by the absence of pigment, and the borders of mutant clones were outlined with red lines. Although inr or akt clones contain few cells, TSC1 inr, or TSC1 akt clones contain many more cells (only portions of the mutant clones are shown in C and D). (A) inr. (B) akt. (C) TSC1 inr. (D) TSC1 akt. (E) TSC1. (F) PTEN. (G) TSC1 PTEN.

References

    1. Aris J P, Blobel G. Identification and characterization of a yeast nucleolar protein that is similar to a rat liver nucleolar protein. J Cell Biol. 1988;107:17–31. - PMC - PubMed
    1. Böhni R, Riesgo-Escovar J, Oldham S, Brogiolo W, Stocker H, Andruss BF, Beckingham K, Hafen E. Autonomous control of cell and organ size by CHICO, a Drosophila homolog of vertebrate IRS1–4. Cell. 1999;97:865–875. - PubMed
    1. Brand AH, Perrimon N. Targeted gene expression as a means of altering cell fates and generating dominant phenotypes. Development. 1993;118:401–415. - PubMed
    1. Bucci C, Parton RG, Mather IH, Stunnenberg H, Simons K, Hoflack B, Zerial M. The small GTPase rab5 functions as a regulatory factor in the early endocytic pathway. Cell. 1992;70:715–728. - PubMed
    1. Cantley LC, Neel BG. New insights into tumor suppression: PTEN suppresses tumor formation by restraining the phosphoinositide 3-kinase / AKT pathway. Proc Natl Acad Sci. 1999;96:4240–4245. - PMC - PubMed

Publication types

MeSH terms