. 2001 Jun 4;193(11):1247-60.
doi: 10.1084/jem.193.11.1247.

Treatment of allergic airway inflammation and hyperresponsiveness by antisense-induced local blockade of GATA-3 expression

Affiliations

Treatment of allergic airway inflammation and hyperresponsiveness by antisense-induced local blockade of GATA-3 expression

S Finotto et al. J Exp Med. .

Abstract

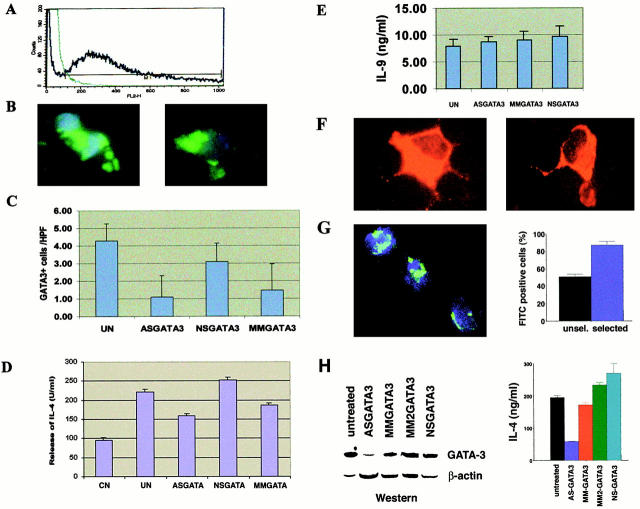
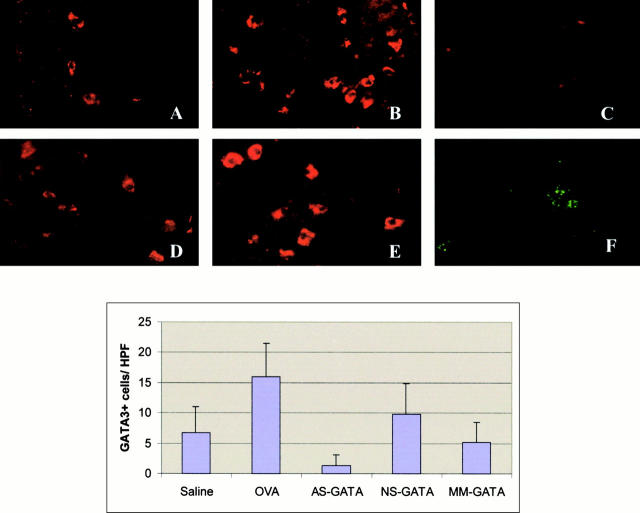
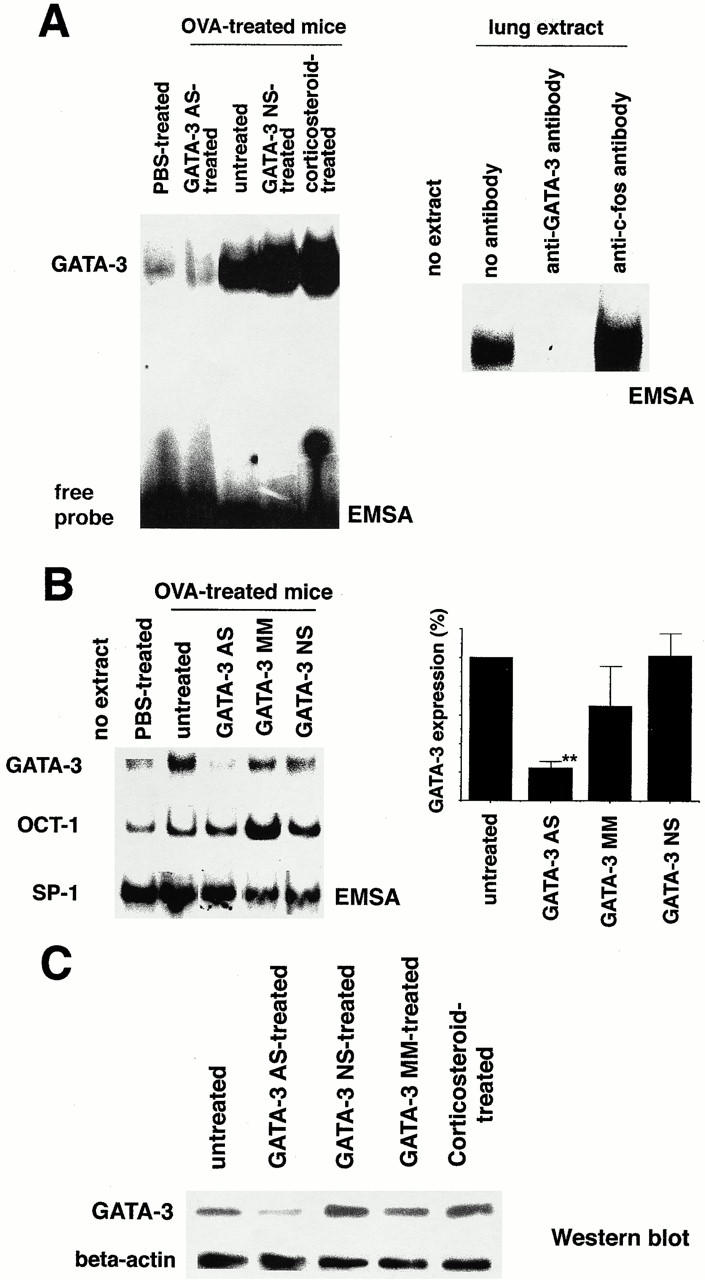
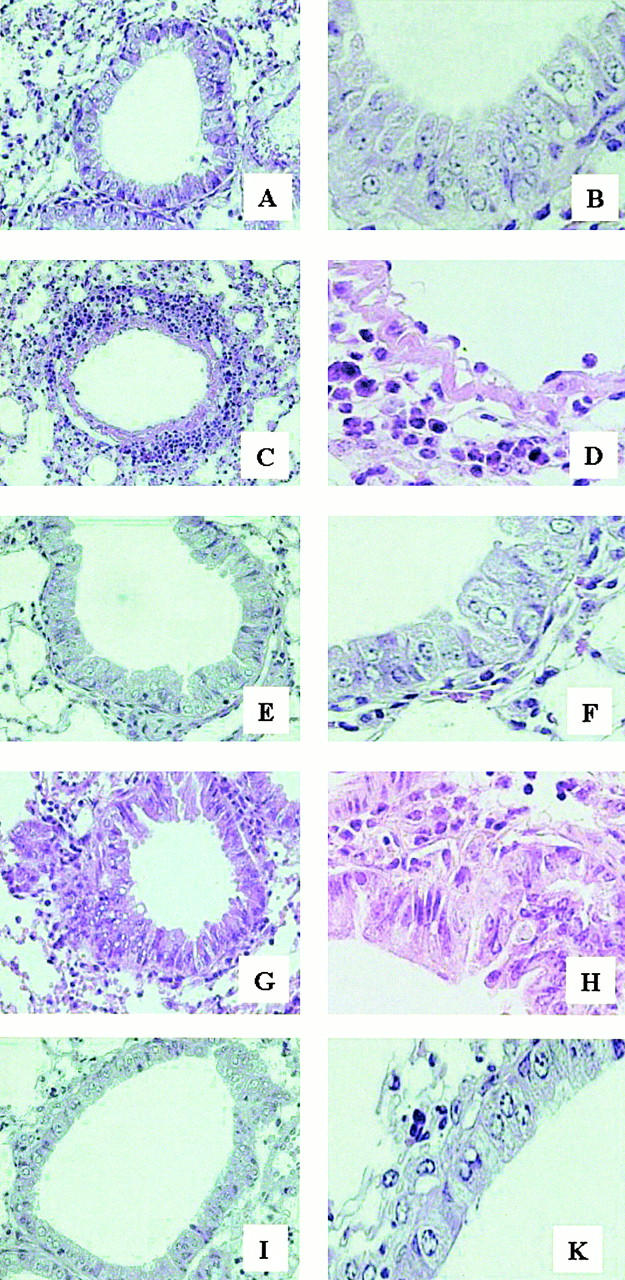
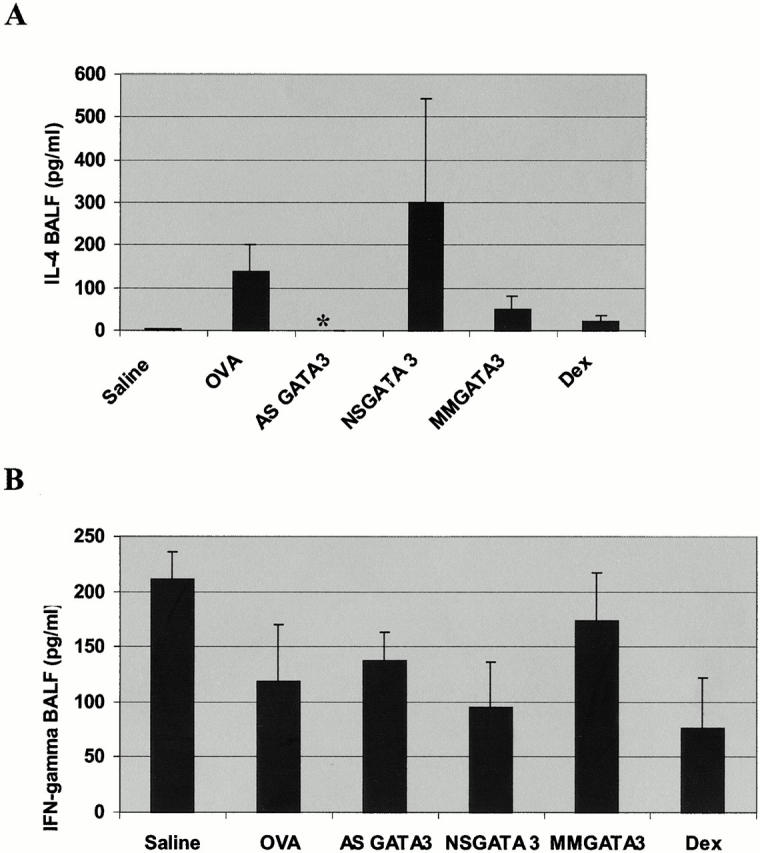
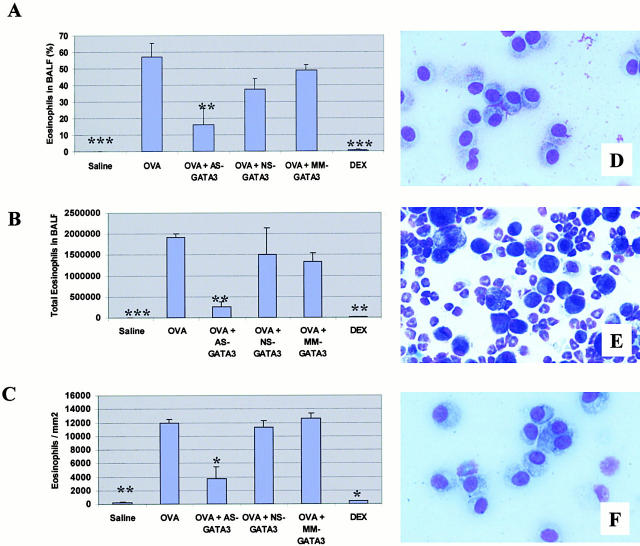
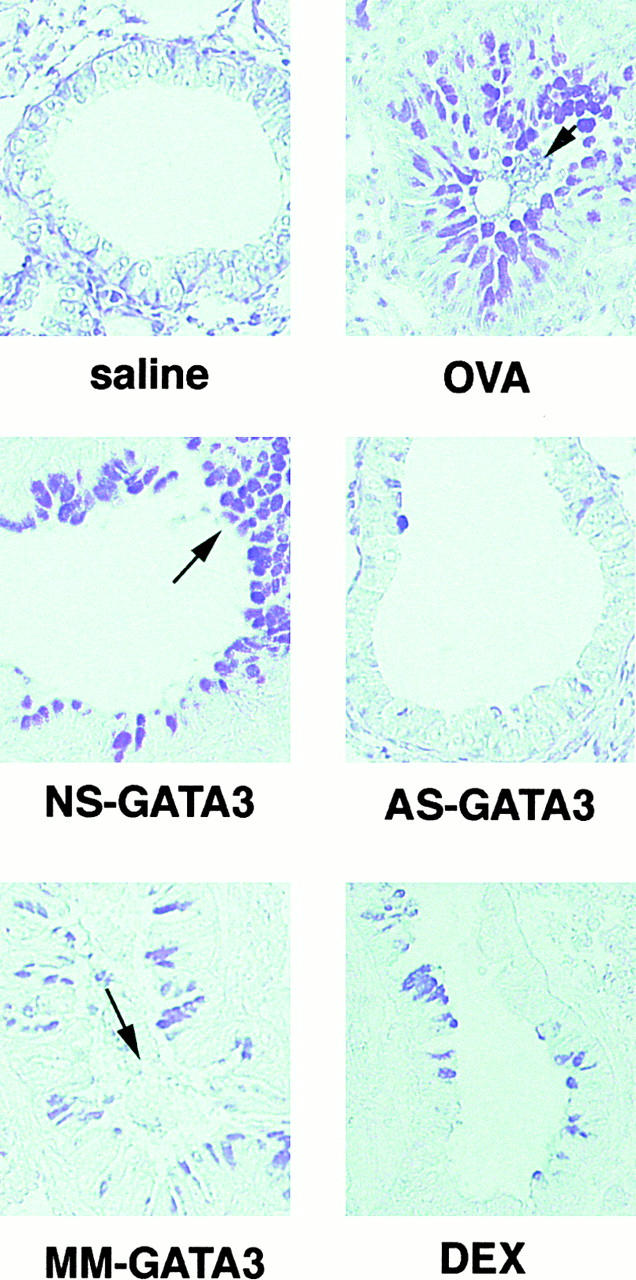
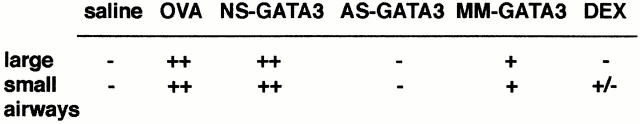
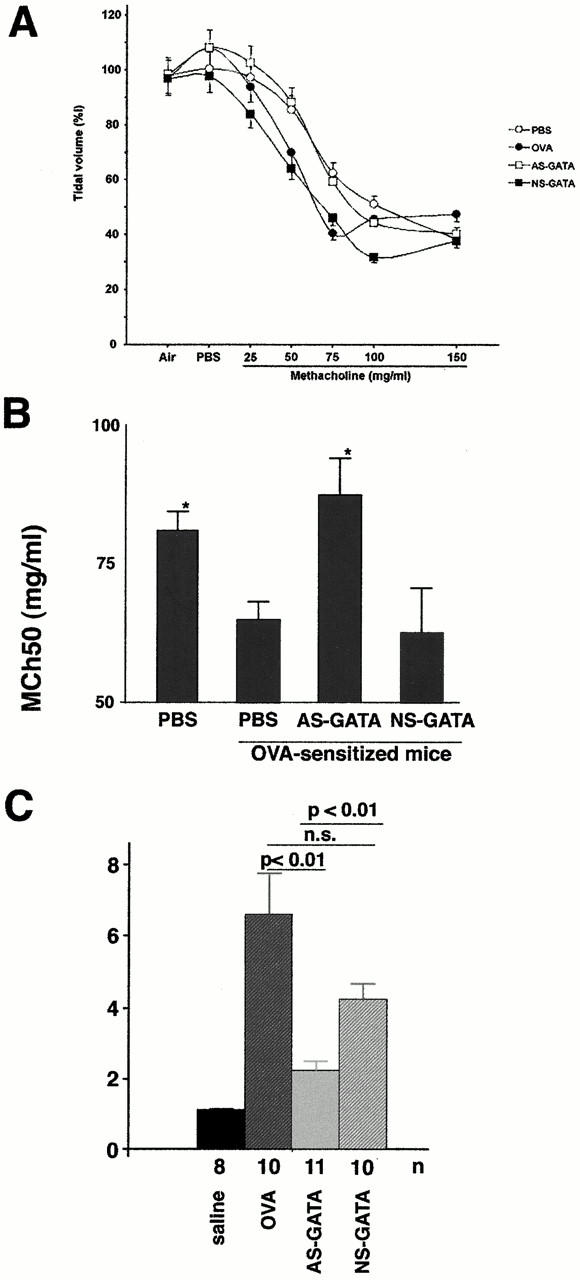
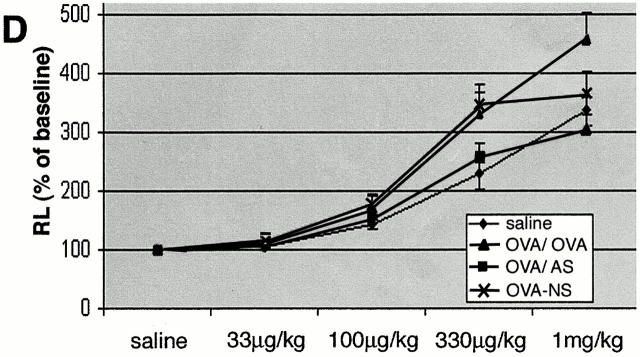
Recent studies in transgenic mice have revealed that expression of a dominant negative form of the transcription factor GATA-3 in T cells can prevent T helper cell type 2 (Th2)-mediated allergic airway inflammation in mice. However, it remains unclear whether GATA-3 plays a role in the effector phase of allergic airway inflammation and whether antagonizing the expression and/or function of GATA-3 can be used for the therapy of allergic airway inflammation and hyperresponsiveness. Here, we analyzed the effects of locally antagonizing GATA-3 function in a murine model of asthma. We could suppress GATA-3 expression in interleukin (IL)-4-producing T cells in vitro and in vivo by an antisense phosphorothioate oligonucleotide overlapping the translation start site of GATA-3, whereas nonsense control oligonucleotides were virtually inactive. In a murine model of asthma associated with allergic pulmonary inflammation and hyperresponsiveness in ovalbumin (OVA)-sensitized mice, local intranasal administration of fluorescein isothiocyanate-labeled GATA-3 antisense oligonucleotides led to DNA uptake in lung cells associated with a reduction of intracellular GATA-3 expression. Such intrapulmonary blockade of GATA-3 expression caused an abrogation of signs of lung inflammation including infiltration of eosinophils and Th2 cytokine production. Furthermore, treatment with antisense but not nonsense oligonucleotides induced a significant reduction of airway hyperresponsiveness in OVA-sensitized mice to levels comparable to saline-treated control mice, as assessed by both enhanced pause (PenH) responses and pulmonary resistance determined by body plethysmography. These data indicate a critical role for GATA-3 in the effector phase of a murine asthma model and suggest that local delivery of GATA-3 antisense oligonucleotides may be a novel approach for the treatment of airway hyperresponsiveness such as in asthma. This approach has the potential advantage of suppressing the expression of various proinflammatory Th2 cytokines simultaneously rather than suppressing the activity of a single cytokine.


Figures

Figure 1
Figure 1
Suppression of IL-4 production and GATA-3 expression in Th2 T cells by a specific phosphorothioate oligonucleotide to the translation start site of GATA-3. To induce Th2 T cell development naive splenic CD4+ T cells (purity > 97%) were cultured on anti-CD3–coated wells in the presence of soluble anti-CD28, rmIL-2, and rmIL-4 for 3 d. Cells were then cultured for an additional 2 d in the presence of rmIL-2 and IL-4 only. During the last 12 h, cells were challenged with PMA (50 ng/ml)/ionomycin (1 μg/ml). At days 2 and 4, oligonucleotides were preincubated with Lipofectamine and added to the cell cultures as indicated. In vitro–differentiated Th2 cells showed high viability under all experimental conditions (UN, 85–95%; ASGATA3, 90–98%; NSGATA3, 75–95%) in three independent experiments as assessed by trypan blue exclusion (data not shown). Coincubation with FITC-labeled antisense oligonucleotides to GATA-3 led to a high degree of DNA uptake (50–70% of cells) as assessed by FACS® analysis (A) and quantitative fluorescence microscopy using nuclear counterstaining with DAPI (B). Antisense oligonucleotides to GATA-3 led to a significant (P < 0.05) reduction of the number of GATA-3–expressing Th2 cells, whereas control nonsense oligonucleotides had no such effect (C). In addition, mismatched oligonucleotides led to a reduction in the number of GATA-3–expressing cells, although this effect was not statistically significant. Cytokine production from untreated and GATA-3 antisense or control-treated cells was assessed by ELISA. The treatment with antisense DNA to GATA-3 significantly (P < 0.05) reduced IL-4 production (D) compared with untreated cells but, in contrast, IL-9 release remained unaffected after antisense GATA-3 treatment (E). In addition, control oligonucleotides had no significant effect on both IL-4 and IL-9 production, although mismatched DNA caused a reduction of the average IL-4 production. (F) High GATA-3 expression in in vitro–differentiated Th2 cells. (G) To enrich for antisense-transfected Th2 cells, we used a cotransfection system with a plasmid expressing a truncated H2-Kk molecule followed by magnetic selection of transfected cells (see Materials and Methods). As shown by confocal laser microscopy (G, left), there was a high DNA uptake in MACS-selected cells, and quantification of FITC-positive cells showed an enrichment of cells transfected with FITC-labeled antisense DNA compared with unselected cells (G, right). There was a downregulation of GATA-3 expression in MACS-selected, antisense-transfected cells compared with untreated MACS-selected T cells as shown by Western blot analysis (H, left). Such downregulation was not observed after treatment with GATA-3 nonsense DNA and two mismatched oligonucleotides and was associated with a marked downregulation of IL-4 production as assessed by ELISA (H, right). AS, antisense; ASGATA3, GATA-3 antisense DNA; NSGATA3, GATA-3 nonsense DNA; NS, nonsense DNA; MM, mismatched oligonucleotides; UN, untreated cells; CN, unstimulated control.
Figure 2
Figure 2
Increased number of GATA-3–producing lung cells in OVA-sensitized mice and inhibition of GATA-3 protein expression after local administration of antisense oligonucleotides. Sections of OVA-immunized (B) and saline-treated control mice (A) were stained with an antibody against GATA-3 (Cy3). OVA immunization caused an upregulation of GATA-3 (B) expression. Intranasal administration of GATA-3 antisense oligonucleotides suppressed GATA-3 (C) expression in the lung of OVA-immunized mice (original magnification: ×400). The same field analyzed for FITC-labeled antisense DNA uptake is shown in F (FITC; emission wavelength, 520 nm). Double staining showed the absence of GATA-3 protein expression in cells with intracellular FITC-labeled antisense DNA to GATA-3 (compare C and F). Local treatment with control oligonucleotides did not change significantly the number of GATA-3–positive cells in the lung compared with OVA-sensibilized airways (nonsense and mismatched oligonucleotide treatment is shown in E and D, respectively), although mismatched DNA led to a reduction in the average number of GATA-3–expressing cells per HPF (bottom panel). In these quantitative studies, GATA-3–positive cells in OVA-immunized mice, GATA-3 antisense, mismatched, and nonsense-treated OVA-immunized mice, and saline-treated control mice were assessed by immunohistochemistry. GATA-3–expressing cells in the lungs were quantified blindly by the same observer (see Materials and Methods). 10 HPFs in the area of peripheral bronchi were randomly selected in nine lung sections from each mouse (five mice per group) for quantification. Counts are given as cells per HPF. AS-GATA, GATA-3 antisense; MM-GATA, mismatched GATA-3; NS-GATA, nonsense GATA-3; OVA, OVA-immunized mice.
Figure 3
Figure 3
Detection of GATA-3 in the lungs of OVA-immunized mice by gel retardation assay (EMSA) and Western blot analysis. (A) Expression of GATA-3 in cellular extracts from lung cells was assessed by EMSA using a GATA-3–specific reference binding site. Unbound radiolabeled probe was separated from DNA–protein complexes by gel electrophoresis under nondenaturing conditions. OVA immunization led to a strong increase of GATA-3 expression in the lung compared with lungs from saline-treated control mice. Whereas treatment with GATA-3 antisense oligonucleotides caused a suppression of GATA-3 expression, treatment with GATA-3 nonsense DNA or corticosteroids had no effect on GATA-3 expression. Specificity of the GATA-3 signal was shown by competition assays using unlabeled GATA-3 oligonucleotides (data not shown) and supershift assays with specific antibodies to GATA-3. Whereas a control antibody had no effect on the GATA-3 complex in EMSA, a complete abrogation of the retarded complex was observed upon addition of the GATA-3–specific antibody (right). (B) Specificity of the effects of GATA-3 antisense oligonucleotides on GATA-3 expression. The expression of GATA-3, OCT-1, and SP-1 transcription factors in cellular extracts from lung cells was assessed by EMSA using specific reference binding sites. Although antisense oligonucleotides to GATA-3 caused a marked reduction of GATA-3 expression, they had no such effect on the expression of OCT-1 and SP-1. The expression of GATA-3 in lung extracts was finally assessed in three independent experiments using EMSA analysis. Quantification of the EMSA bands in these three experiments is depicted on the right (signal in untreated conditions was defined as 100%). Whereas GATA-3 antisense DNA led to a significant (P < 0.01) reduction of GATA-3 expression, nonsense DNA had no such effect. Mismatched DNA had no significant effect on GATA-3 expression, although a reduction in the average GATA-3 signal was noted. **P < 0.01. (C) Western blot analysis for GATA-3 and β-actin expression in the lungs of OVA-immunized mice. Extracts from lung tissue were analyzed using a GATA-3–specific antibody. GATA-3 antisense DNA treatment led to a suppression of GATA-3 expression, whereas control nonsense GATA-3 oligonucleotides and corticosteroids had no such effect. One representative out of three lungs per group is shown. 50 μg of proteins per lane was loaded. Equal loading was also confirmed after 5 min staining of the nitrocellulose membrane with Ponceau's solution (data not shown). AS, antisense; NS, nonsense; MM, mismatched.
Figure 4
Figure 4
Histologic evidence of airway inflammation in OVA-sensitized and control mice; effect of GATA-3 antisense treatment. Lung tissue was analyzed from untreated (C and D) and antisense-treated (E and F) OVA-sensitized mice. In untreated mice, a massive peribronchial infiltration with eosinophils, thickening of the basement membrane, and deepithelialization were seen (see higher magnification in D: ×400). In contrast, after treatment with antisense DNA to GATA-3 an intact bronchial epithelial layer and no eosinophil infiltration were seen (E and F) comparable to DEX treatment (I and K). Lung tissues taken from sham (saline)- sensitized mice (A and B) and OVA-immunized mice treated with nonsense DNA (G and H) are shown as control. Lung sections were stained with hematoxylin and eosin and examined by light microscopy. Original magnifications: (A, C, E, G, and H) ×200; (B, D, F, H, and K) ×400.
Figure 6
Figure 6
GATA-3 antisense treatment selectively reduces Th2 cytokine concentration in the BALF. Analysis of Th1 and Th2 cytokine concentration in the BAL from lungs of saline-treated mice (PBS; n = 4), OVA-sensitized mice (n = 4), and OVA-sensitized mice treated with GATA-3 antisense DNA (n = 5), GATA-3 nonsense DNA (n = 4), GATA-3 mismatched DNA (n = 4), or DEX (n = 4). Cytokine levels (IFN-γ, IL-4) were determined by specific ELISA and are reported as mean values ± SEM. IFN-γ and IL-4 levels were between 17 and 234 pg/ml and 35 and 435 pg/ml, respectively. AS GATA3, OVA-sensitized mice treated with GATA-3 antisense DNA; MMGATA3, GATA-3 mismatched DNA; NSGATA3, GATA-3 nonsense DNA; OVA, OVA-sensitized mice.
Figure 5
Figure 5
Infiltration of eosinophils into the airways is abrogated by local administration of GATA-3 antisense oligonucleotides (significance: *P < 0.05; **P < 0.01; **P < 0.001). (A) Eosinophils in the BALF were detected on cytospins after staining according to May-Grünwald Giemsa and quantified after counting of 200 cells. Data are reported as the mean percentage of eosinophils in the BAL ± SEM (n = 4–5 animals per group). (B) Absolute eosinophil numbers ± SEM in the recovered BALF. Results were obtained by multiplying the percentage of eosinophils with the total cell number per milliliter and the recovered volume of the BALF. (C) Three representative fields around peripheral bronchi of similar size were randomly selected from lung sections and eosinophils were counted with a computerized system (see Materials and Methods). Data are reported as the mean number of eosinophils per mm2 ± SEM. Significant differences compared with OVA treatment are indicated. (D–F) A representative field of the BALF from a saline-treated mouse (D) and an OVA-sensitized animal with (F) or without (E) antisense GATA-3 DNA treatment are shown. Cytospins were stained with May-Grünwald Giemsa. AS, antisense; NS, nonsense; MM, mismatched.
Figure 7
Figure 7
Mucus occlusion of lower airways in OVA-treated mice (OVA) compared with saline-treated mice (saline). The acidic and neutral mucosubstances are stained in magenta by the alcian blue/PAS reaction. The treatment with antisense DNA to GATA-3 (AS-GATA3) led to a strong reduction of the PAS reaction in the airways of OVA-sensitized mice. This effect was comparable to DEX treatment. No effect was observed after nonsense DNA treatment (NS-GATA3), whereas mismatched DNA (MM-GATA3) led to a small reduction in mucus production. The differences in mucus production were also assessed by semiquantitative analysis of mucosubstances in the small and large airways of four to five mice per group. The mean values are shown. Antisense DNA to GATA-3 led to an abrogation of mucus production, whereas nonsense DNA had no effects compared with OVA-sensitized untreated mice. Mismatched DNA led to a detectable reduction in mucus production, although this effect was much lower compared with GATA-3 antisense DNA. Bottom table: −, no mucosubstances; +, mucosubstances detectable; ++, high amount of mucosubstances.
Figure 7
Figure 7
Mucus occlusion of lower airways in OVA-treated mice (OVA) compared with saline-treated mice (saline). The acidic and neutral mucosubstances are stained in magenta by the alcian blue/PAS reaction. The treatment with antisense DNA to GATA-3 (AS-GATA3) led to a strong reduction of the PAS reaction in the airways of OVA-sensitized mice. This effect was comparable to DEX treatment. No effect was observed after nonsense DNA treatment (NS-GATA3), whereas mismatched DNA (MM-GATA3) led to a small reduction in mucus production. The differences in mucus production were also assessed by semiquantitative analysis of mucosubstances in the small and large airways of four to five mice per group. The mean values are shown. Antisense DNA to GATA-3 led to an abrogation of mucus production, whereas nonsense DNA had no effects compared with OVA-sensitized untreated mice. Mismatched DNA led to a detectable reduction in mucus production, although this effect was much lower compared with GATA-3 antisense DNA. Bottom table: −, no mucosubstances; +, mucosubstances detectable; ++, high amount of mucosubstances.
Figure 8
Figure 8
Assessment of airway reactivity in BALB/c mice after GATA-3 antisense treatment using three independent methods to assess airway hyperreactivity in vivo. (A) 12 BALB/c mice per group were sensitized to OVA accompanied by local treatment with OVA alone (PBS, OVA-sensitized mice), OVA followed by either GATA-3 antisense oligonucleotides (AS-GATA), or GATA-3 nonsense oligonucleotides (NS-GATA). Body plethysmography was performed 24 h after the last local treatment in all 12 mice per group as specified in Materials and Methods. Airway reactivity was measured in nonanaesthetized, spontaneously breathing mice simultaneously during MCh aerosol exposure. Basal values were measured (air), followed by measuring the response to aerosolized saline (PBS) and to increasing concentrations of MCh (25–150 mg/ml). Values expressed are mean ± SEM of tidal volume (%). (B) Analysis of the MCh concentration that caused a 50% reduction in expiratory airflow (MCh50; reference 33) in the plethysmography experiments described in A. Data represent mean values ± SEM. *P < 0.05. (C) Airway responsiveness in OVA- and saline-treated mice was assessed by analyzing PenH responses in a body plethysmograph. Mice were treated with saline (n = 8) or sensitized to OVA followed by local treatment with OVA alone (OVA; n = 10), GATA-3 antisense oligonucleotides (AS-GATA; n = 11) or GATA-3 nonsense oligonucleotides (NS-GATA; n = 10), as described above. Measurements of MCh responsiveness were made after exposure for 5 min to 200 mg/ml of aerosolized MCh and monitoring PenH. Results are expressed as the mean peak of PenH within 5 min after MCh treatment ± SEM. Data were pooled from two independent experiments. Whereas treatment with antisense oligonucleotides to GATA-3 caused a significant reduction of PenH values (P < 0.01), treatment with nonsense control DNA did not have a significant effect. Furthermore, treatment of OVA-sensitized mice with antisense DNA led to a significant reduction of PenH values (P < 0.01) compared with nonsense, control-treated mice. (D) Analysis of RL in anesthetized, OVA-, or saline-treated mice by body plethysmography. Mice were treated with saline (n = 8) or sensitized to OVA followed by local treatment with OVA alone (OVA/OVA; n = 11), GATA-3 antisense oligonucleotides (OVA/AS; n = 11), or GATA-3-nonsense oligonucleotides (OVA/NS; n = 12). Body plethysmography was performed 24 h after the last local treatment in all mice. Dose–response curves to MCh were obtained after administering indicated doses of intravenous MCh. Data were pooled from two independent experiments and are expressed as mean values of RL ± SEM. Multivariate analysis showed a significant increase of RL after OVA treatment compared with saline treatment (P < 0.05). Treatment with antisense oligonucleotides to GATA-3 led to a significant suppression of RL values compared with untreated, OVA-sensitized mice (P < 0.01), whereas nonsense control DNA did not have a significant effect. Furthermore, treatment of OVA-sensitized mice with antisense DNA caused a significant suppression of RL values compared with nonsense-treated, OVA-sensitized mice (P < 0.05).
Figure 8
Figure 8
Assessment of airway reactivity in BALB/c mice after GATA-3 antisense treatment using three independent methods to assess airway hyperreactivity in vivo. (A) 12 BALB/c mice per group were sensitized to OVA accompanied by local treatment with OVA alone (PBS, OVA-sensitized mice), OVA followed by either GATA-3 antisense oligonucleotides (AS-GATA), or GATA-3 nonsense oligonucleotides (NS-GATA). Body plethysmography was performed 24 h after the last local treatment in all 12 mice per group as specified in Materials and Methods. Airway reactivity was measured in nonanaesthetized, spontaneously breathing mice simultaneously during MCh aerosol exposure. Basal values were measured (air), followed by measuring the response to aerosolized saline (PBS) and to increasing concentrations of MCh (25–150 mg/ml). Values expressed are mean ± SEM of tidal volume (%). (B) Analysis of the MCh concentration that caused a 50% reduction in expiratory airflow (MCh50; reference 33) in the plethysmography experiments described in A. Data represent mean values ± SEM. *P < 0.05. (C) Airway responsiveness in OVA- and saline-treated mice was assessed by analyzing PenH responses in a body plethysmograph. Mice were treated with saline (n = 8) or sensitized to OVA followed by local treatment with OVA alone (OVA; n = 10), GATA-3 antisense oligonucleotides (AS-GATA; n = 11) or GATA-3 nonsense oligonucleotides (NS-GATA; n = 10), as described above. Measurements of MCh responsiveness were made after exposure for 5 min to 200 mg/ml of aerosolized MCh and monitoring PenH. Results are expressed as the mean peak of PenH within 5 min after MCh treatment ± SEM. Data were pooled from two independent experiments. Whereas treatment with antisense oligonucleotides to GATA-3 caused a significant reduction of PenH values (P < 0.01), treatment with nonsense control DNA did not have a significant effect. Furthermore, treatment of OVA-sensitized mice with antisense DNA led to a significant reduction of PenH values (P < 0.01) compared with nonsense, control-treated mice. (D) Analysis of RL in anesthetized, OVA-, or saline-treated mice by body plethysmography. Mice were treated with saline (n = 8) or sensitized to OVA followed by local treatment with OVA alone (OVA/OVA; n = 11), GATA-3 antisense oligonucleotides (OVA/AS; n = 11), or GATA-3-nonsense oligonucleotides (OVA/NS; n = 12). Body plethysmography was performed 24 h after the last local treatment in all mice. Dose–response curves to MCh were obtained after administering indicated doses of intravenous MCh. Data were pooled from two independent experiments and are expressed as mean values of RL ± SEM. Multivariate analysis showed a significant increase of RL after OVA treatment compared with saline treatment (P < 0.05). Treatment with antisense oligonucleotides to GATA-3 led to a significant suppression of RL values compared with untreated, OVA-sensitized mice (P < 0.01), whereas nonsense control DNA did not have a significant effect. Furthermore, treatment of OVA-sensitized mice with antisense DNA caused a significant suppression of RL values compared with nonsense-treated, OVA-sensitized mice (P < 0.05).

References

    1. Kon O.M., Kay A.B. T cells and chronic asthma. Int. Arch. Allergy Immunol. 1999;118:133–135. - PubMed
    1. Kaliner M.A. Pathogenesis of asthma. In: Rich R.R., editor. Clinical Immunology. Mosby; St. Louis: 1996. pp. 909–923.
    1. Gelfand E.W. Essential role of T lymphocytes in the development of allergen-driven airway hyperresponsiveness. Allergy Asthma Proc. 1998;19:365–369. - PubMed
    1. Holgate S.T. The epidemic of allergy and asthma Nature. 402Suppl.1999. B2 B4 - PubMed
    1. Zhu Z., Horner R.J., Wang Z., Chen Q., Geba G.P., Wang J., Zhang Y., Elias J.A. Pulmonary expression of interleukin-13 causes inflammation, mucus hypersecretion, subepithelial fibrosis, physiologic abnormalities, and eotaxin production. J. Clin. Invest. 1999;103:779–788. - PMC - PubMed

Publication types