. 2001 Jul;21(13):4347-68.
doi: 10.1128/MCB.21.13.4347-4368.2001.

Transcriptional profiling shows that Gcn4p is a master regulator of gene expression during amino acid starvation in yeast

Affiliations

Transcriptional profiling shows that Gcn4p is a master regulator of gene expression during amino acid starvation in yeast

K Natarajan et al. Mol Cell Biol. 2001 Jul.

Abstract

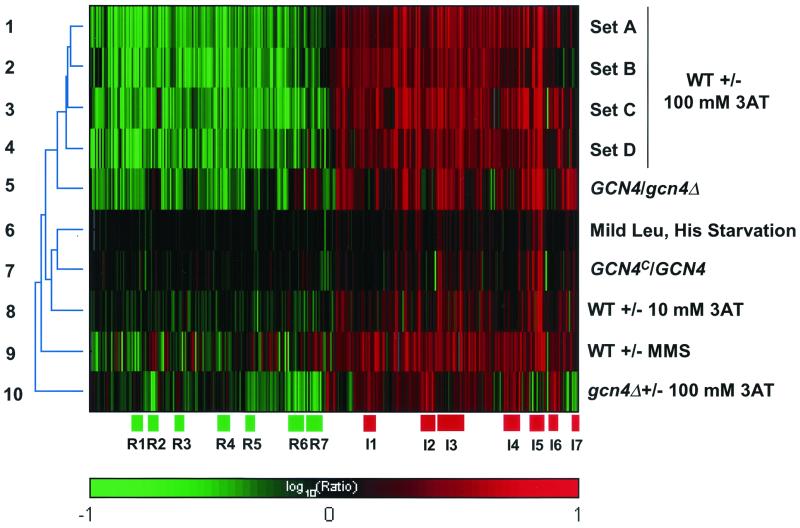
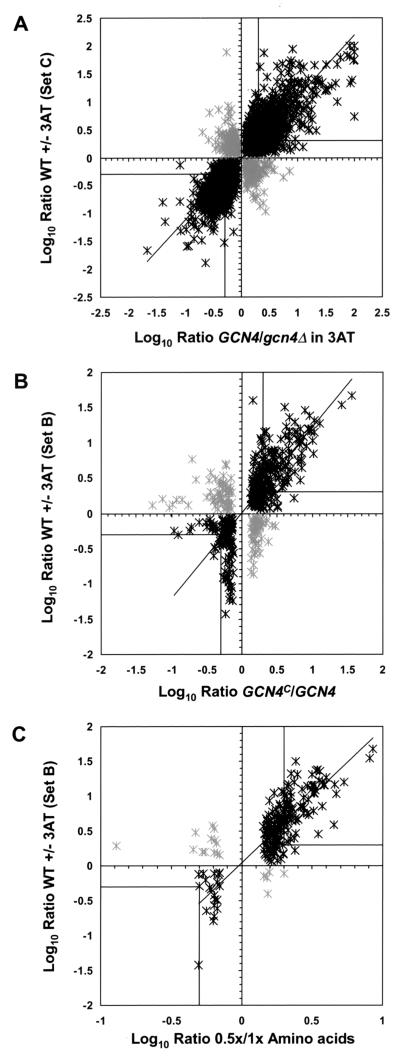
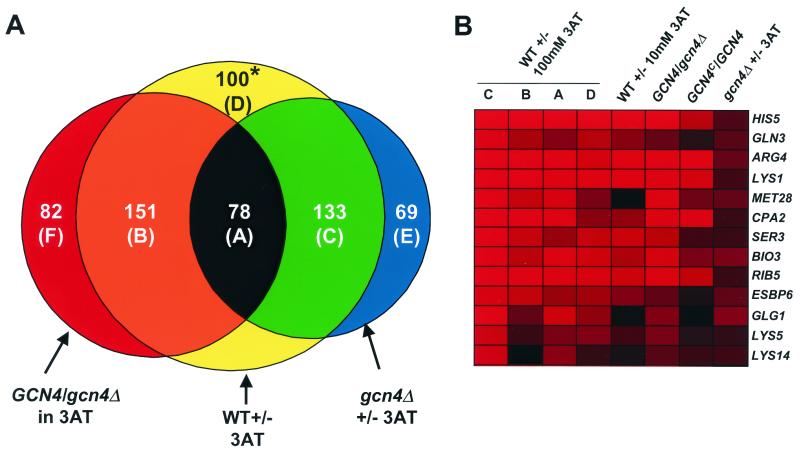
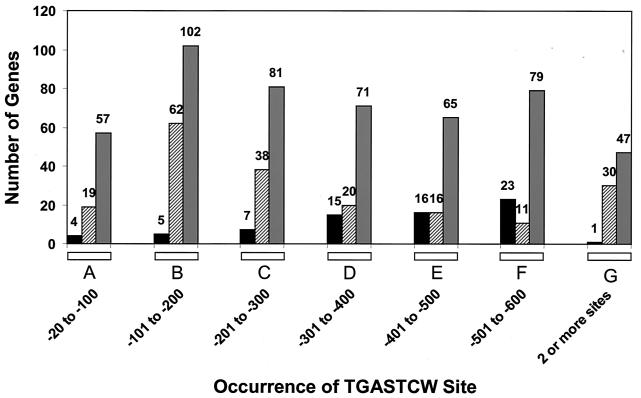
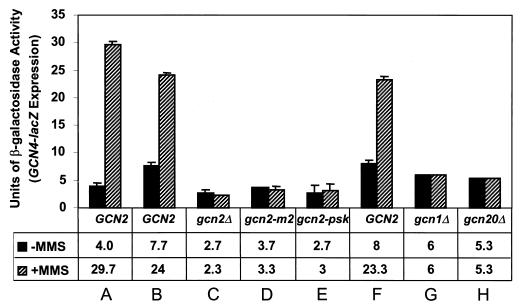
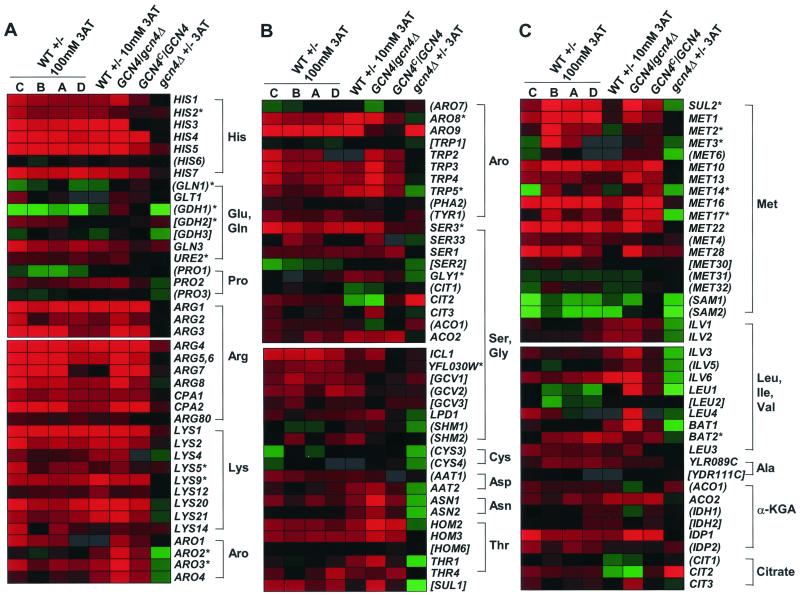
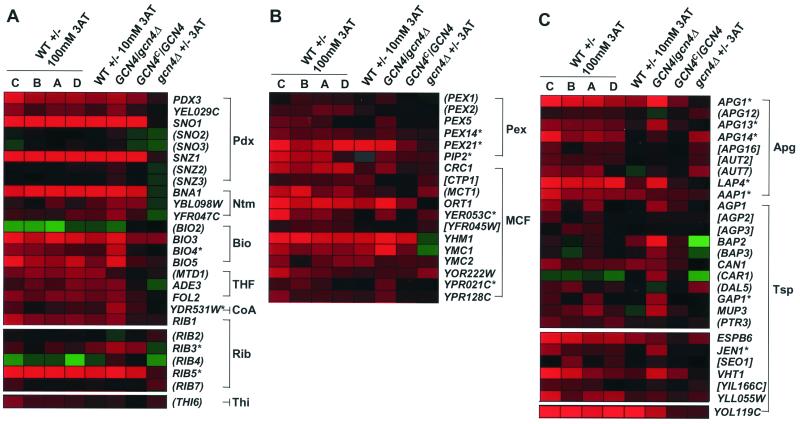
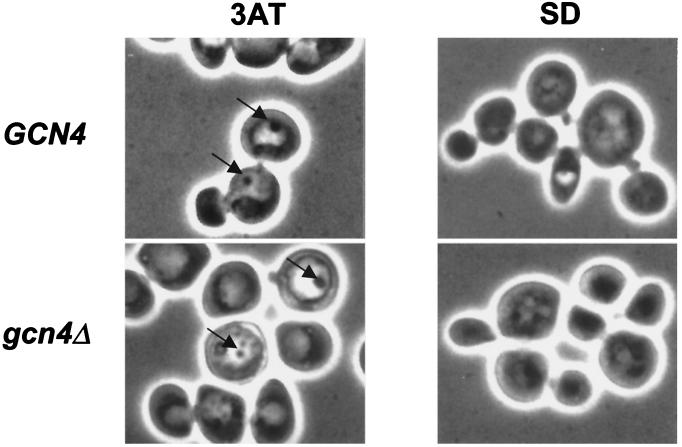
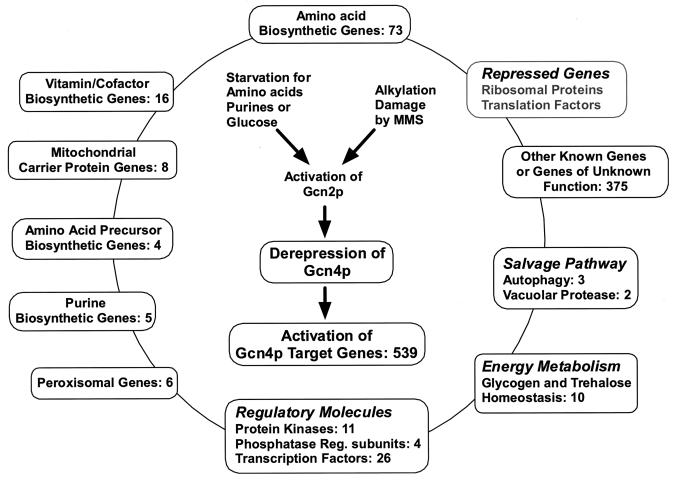
Starvation for amino acids induces Gcn4p, a transcriptional activator of amino acid biosynthetic genes in Saccharomyces cerevisiae. In an effort to identify all genes regulated by Gcn4p during amino acid starvation, we performed cDNA microarray analysis. Data from 21 pairs of hybridization experiments using two different strains derived from S288c revealed that more than 1,000 genes were induced, and a similar number were repressed, by a factor of 2 or more in response to histidine starvation imposed by 3-aminotriazole (3AT). Profiling of a gcn4Delta strain and a constitutively induced mutant showed that Gcn4p is required for the full induction by 3AT of at least 539 genes, termed Gcn4p targets. Genes in every amino acid biosynthetic pathway except cysteine and genes encoding amino acid precursors, vitamin biosynthetic enzymes, peroxisomal components, mitochondrial carrier proteins, and autophagy proteins were all identified as Gcn4p targets. Unexpectedly, genes involved in amino acid biosynthesis represent only a quarter of the Gcn4p target genes. Gcn4p also activates genes involved in glycogen homeostasis, and mutant analysis showed that Gcn4p suppresses glycogen levels in amino acid-starved cells. Numerous genes encoding protein kinases and transcription factors were identified as targets, suggesting that Gcn4p is a master regulator of gene expression. Interestingly, expression profiles for 3AT and the alkylating agent methyl methanesulfonate (MMS) overlapped extensively, and MMS induced GCN4 translation. Thus, the broad transcriptional response evoked by Gcn4p is produced by diverse stress conditions. Finally, profiling of a gcn4Delta mutant uncovered an alternative induction pathway operating at many Gcn4p target genes in histidine-starved cells.


Figures

FIG. 1
FIG. 1
Hierarchical two-dimensional clustering analysis of the results from 10 microarray experiments involving 60 hybridizations. The color scale at the bottom represents the log10 ratio of hybridization signals obtained with the experimental samples to signals from control RNA samples, ranging from −1.0 (brightest green, 10-fold repressed) to 1.0 (brightest red, 10-fold induced). The log10 ratios for 2,528 genes with P values of ≤0.05 and at least twofold changes in expression were plotted along the x axis for the different experiments listed along the y axis. Details of experiments 1 to 3, 5, 7, and 10 are given in Table 2. Experiment 4 was conducted independently of experiments 1 and 2 with strain R491, and the data shown are the average expression ratios from one pair of hybridizations. The data from experiments 8 (WT ± 10 mM 3AT) (66) and 9 (WT with or without MMS) (48) were described previously. The data for experiment 6 were obtained by comparing the expression profiles of auxotrophic strain R491 grown with limiting amino acids and the same strain grown with abundant amino acids. The dendrogram on the left depicts the relatedness of expression profiles for the different experiments. Blocks R1, R3, and R4 shown below row 10 depict clusters of genes that were repressed by 3AT in WT but not in a gcn4Δ mutant and showed strong Gcn4p dependence in the GCN4/gcn4Δ experiment. Gene clusters R2, R5, R6, and R7 were repressed by 3AT in both WT and gcn4Δ strains and showed no Gcn4p dependence in the GCN4/gcn4Δ experiment. Clusters I1, I2, I4, and I6 depict genes that were induced in both WT and gcn4Δ strains and showed no Gcn4p dependence in the GCN4/gcn4Δ experiment. Clusters I3 and I5 represent canonical Gcn4p target genes that were induced by 3AT in WT but showed little or no induction in the gcn4Δ strain and displayed Gcn4p dependence in the GCN4/gcn4Δ and GCN4c/GCN4 experiments. Cluster I7 was repressed in the gcn4Δ strain and showed little or no induction in WT treated with 100 mM 3AT but was induced by 10 mM 3AT and displayed strong Gcn4p dependence in the GCN4/gcn4Δ experiment; hence, it was judged to contain Gcn4p target genes. A different version of this figure using alternative colors can be obtained at http://www.rii.com/tech/pubs/mcb2001.htm.
FIG. 2
FIG. 2
Log10 ratio scatter plots comparing expression profiles from different experiments. The log10 ratios of expression for all genes with P values of ≤0.05 in two experiments being compared were plotted against one another. Black stars depict genes whose expression profiles were correlated, while gray stars depict genes with negatively correlated expression profiles. A trend line was generated for the genes depicted by black stars. Genes induced (log10 ratio ≥ +0.30) or repressed (log10 ratio ≤ −0.30) twofold or more are enclosed in a box in the upper right or the lower left quadrants, respectively. (A) Comparison of data set C (WT ± 100 mM 3AT) with the GCN4/gcn4Δ data set. (B) Comparison of data set B (WT ± 100 mM 3AT) with the GCN4c/GCN4 data set. (C) Comparison of data set B (WT ± 100 mM 3AT) with the 0.5×/1× amino acid data set.
FIG. 3
FIG. 3
A fraction of Gcn4p target genes is induced by 3AT in gcn4Δ cells. (A) Venn diagram depicting the overlap among 613 genes for which statistically significant data were obtained (P ≤ 0.05) and that showed an induction ratio of ≥2 in the WT ± 3AT (set C), GCN4/gcn4Δ, or gcn4Δ ± 3AT experiments. There are 229 Gcn4p target genes (sectors A and B) found at the intersection between 462 genes induced by 3AT in the WT (sectors A, B, C, and D) and 311 genes showing Gcn4p dependence for induction in the GCN4/gcn4Δ experiment (sectors F, B, and A). There were 280 genes induced by 3AT in the gcn4Δ ± 3AT experiment (sectors A, C, and E). The 151 genes in sector B are Gcn4p targets that were not induced by 3AT in the gcn4Δ strain and thus are completely dependent on Gcn4p for induction. Sector A contains the subset of Gcn4p target genes that were also induced by 3AT in the gcn4Δ mutant. These 78 genes are subject to dual regulation and require Gcn4p only for maximal induction by 3AT. Sector C is comprised of the 133 genes induced by 3AT in both gcn4Δ and WT cells which showed little or no dependence on Gcn4p in the GCN4/gcn4Δ experiment (induction ratio of <2-fold). These genes are induced by 3AT independently of Gcn4p. Thus, ∼50% of the genes induced by 3AT in the WT are designated Gcn4p targets because of their dependence on Gcn4p for maximal induction ([A + B]/[A + B + C + D]), and 34% of these target genes (A/[A + B]) can be induced by 3AT even in the absence of Gcn4p. The genes in sector F showed greater expression in WT cells than in gcn4Δ cells in the presence of 3AT but were not induced by 3AT in the WT. This class includes additional Gcn4p targets that depend on Gcn4p primarily to prevent repression in histidine-starved cells (see text). The genes in sector E were induced only in gcn4Δ cells and thus belong to the class of genes induced by 3AT independently of Gcn4p. The results obtained for the 100 genes in sector D marked with an asterisk are paradoxical in that any genes induced by 3AT in the WT should be either dependent on (sector A or B) or independent of (sector C) Gcn4p for their induction. Close examination of this group revealed that 28 genes were induced only in the single WT ± 3AT experiment used to construct this diagram (data set C) but not in other experiments of the same type (data set A, B, or D); hence, these 28 genes probably are not 3AT inducible. Fifty of the remaining genes in sector D showed induction ratios between 1.5 and 2.0 in the GCN4/gcn4Δ experiment and most likely belong to sector A or B, comprising the Gcn4p targets. Fifteen of the remaining genes had induction ratios between 1.5 and 2.0 in the gcn4Δ ± 3AT experiment and probably belong to sector C or E, comprising the Gcn4p-independent 3AT-inducible genes. Among the 133 genes assigned to sector C, 53 had induction ratios between 1.5- and 2-fold in the GCN4/gcn4Δ experiment, suggesting that they belong to sector A: Gcn4p targets that are also inducible by a Gcn4p-independent mechanism. (B) Color display plot of the expression ratios of selected Gcn4p target genes that were induced ≥1.9-fold by 3AT in the gcn4Δ strain. The log10 ratios of expression are depicted using the color code described for Fig. 1, with the brightest red depicting log10 ratios of ≥1.0 and black signifying no significant change in expression (P > 0.05). Data were taken from the different experiments listed across the top (as defined in Fig. 1 and Table 2) for the genes listed on the right.
FIG. 4
FIG. 4
Correlation between Gcn4p-dependent induction by 3AT and the presence of Gcn4p binding sites in the 5′ noncoding DNA. The location of the Gcn4p binding site TGASTCW was determined for all genes identified in the GCN4/gcn4Δ experiment. Genes that harbor two or more binding sites between −20 and −600 were assigned to a single group (column G), and those with a single site were divided into separate groups (columns A to F) depending on the location of the site. The gray bars represent the total numbers of genes in each category; the striped bars depict the numbers of genes with induction ratios of ≥2-fold, and the black bars represent the numbers with repression ratios of ≥2-fold, in the GCN4/gcn4Δ experiment.
FIG. 5
FIG. 5
MMS induces GCN4-lacZ expression dependent on translational activators of GCN4. The β-galactosidase activity expressed from a GCN4-lacZ fusion was assayed in extracts from untreated (black bars) or MMS-treated (striped bars) cultures of prototrophic strain H187 grown in YPD medium (column A). The same fusion was assayed in extracts from gcn2Δ strains harboring plasmids bearing GCN2 (column B), no allele (column C), the gcn2-m2 allele (column D), or the gcn2-psk allele (column E) cultured in SC medium with or without MMS. Finally, GCN4-lacZ was assayed in isogenic WT (column F), gcn1Δ (column G), or gcn20Δ (column H) strains grown in SC medium with or without MMS. Error bars depict the standard errors of the means of activities measured from at least three independent cultures or transformants.
FIG. 6
FIG. 6
Color display plots of the expression ratios of genes involved in amino acid biosynthesis. Genes that are known or predicted to participate in the biosynthesis of amino acids, or amino acid precursors, are indicated on the right, and the log10 ratios of expression for the experiments listed along the top are displayed using the color code described for Fig. 1. (Gray indicates that no data were obtained for that gene.) Genes that were not judged to be Gcn4p targets are shown in parentheses, and those for which insufficient data exist to assess Gcn4p dependence are enclosed in brackets. (Expression of TRP1 and LEU2 could not be assessed because most of the strains that we analyzed have trp1 and leu2 mutations. Although strains R6257 and R4760 used in the GCN4c/GCN4 experiment carry TRP1, statistically significant data were not obtained for TRP1 in that experiment.) Asterisks indicate Gcn4p target genes lacking a recognizable Gcn4p binding site (TGASTCW, TGACTGA, or TGATTCA) in the −20 to −600 region of the promoter. (A) Results for genes in the His, Glu, Gln, Pro, Arg, Lys, or aromatic (Aro) amino acid biosynthetic pathways. (B) Results for genes in the aromatic, Ser, Gly, Cys, Asp, Asn, and Thr biosynthetic pathways. (C) Results for genes in the Met, Leu, Ile, Val, Ala, α-ketoglutarate (α-KGA), and citrate biosynthetic pathways.
FIG. 7
FIG. 7
Color display plots of the expression ratios for genes involved in selected pathways that may contribute indirectly to amino acid biosynthesis or accumulation. The log10 ratios of expression for the genes indicated on the right in the experiments listed across the top are displayed using the color code defined for Fig. 1. (A) Results for genes known or suspected to be involved in biosynthesis of pyridoxal phosphate (Pdx), nicotinamide (Ntm), biotin (Bio), THF, riboflavin (Rib), and thiamine (Thi). (B) Results for genes involved in peroxisome (Pex) biogenesis or belonging to the MCF. (C) Results for genes involved in autophagy (Apg) or belonging to the transporter (Tsp) family.
FIG. 8
FIG. 8
Autophagy is induced by amino acid starvation. Strains KNY201 (GCN4) and KNY202 (gcn4Δ) were cultured in YPD medium to an OD600 of 1.0, harvested, washed with minimal (SD) medium, resuspended in SD medium or in SD medium containing 40 mM 3AT (3AT), and incubated with shaking for 4.5 h. Aliquots of cells were removed and visualized by phase-contrast microscopy. The arrows indicate dense bodies inside the vacuoles that exhibited Brownian motion, judged to be autophagic vesicles.
FIG. 9
FIG. 9
Evidence that Gcn4p promotes reduced glycogen levels during amino acid starvation. Strains KNY164 (GCN4) and KNY124 (gcn4Δ) were cultured in SD medium for 40 h, harvested, washed with SD medium, resuspended in either SD medium or SD medium containing SM, and incubated with shaking at 30°C. Aliquots of cells corresponding to 3.0 OD600 units were harvested at 0, 2, and 4 h and assayed for glycogen by iodine staining for 11 min (0 h) or 14 min (2 h and 4 h). The OD600 values of the cultures at different time points are indicated.
FIG. 10
FIG. 10
Schematic representation of functional categories of Gcn4p target genes. Starvation for any of several nutrients or treatment with MMS leads to activation of protein kinase Gcn2p with attendant derepression of GCN4 translation. The induced level of Gcn4p elicits transcriptional activation of at least 539 genes, designated Gcn4p targets. These genes (depicted in black) were induced ≥2-fold in at least one of the four WT ± 3AT experiments and had an induction ratio of ≥2.0 in the GCN4/gcn4Δ or GCN4c/GCN4 experiments. The numbers of Gcn4p targets in different functional categories also are indicated. A large number of genes were repressed by a factor of ≥2 in response to 3AT treatment and were dependent on Gcn4p for maximal repression under these conditions. Prominent among these repressed genes were those encoding RP and translation initiation factors (shown in gray). Gene names and functions were obtained from the Saccharomyces Genome Database (http://genome-www.stanford.edu/Saccharomyces/) and the Yeast Proteome Database (12), and genes were assigned to groups based on the MIPS functional categories (69).

References

    1. Albrecht G, Mosch H U, Hoffmann B, Reusser U, Braus G H. Monitoring the Gcn4 protein-mediated response in the yeast Saccharomyces cerevisiae. J Biol Chem. 1998;273:12696–12702. - PubMed
    1. Arndt K, Fink G R. GCN4 protein, a positive transcription factor in yeast, binds general control promoters at all 5′ TGACTC 3′ sequences. Proc Natl Acad Sci USA. 1986;83:8516–8520. - PMC - PubMed
    1. Arndt K T, Styles C, Fink G R. Multiple global regulators control HIS4 transcription in yeast. Science. 1987;237:874–880. - PubMed
    1. Belotserkovskaya R, Sterner D E, Deng M, Sayre M H, Lieberman P M, Berger S L. Inhibition of TATA-binding protein function by SAGA subunits Spt3 and Spt8 at Gcn4-activated promoters. Mol Cell Biol. 2000;20:634–647. - PMC - PubMed
    1. Braus G H. Aromatic amino acid biosynthesis in the yeast Saccharomyces cerevisiae: a model system for the regulation of a eukaryotic biosynthetic pathway. Microbiol Rev. 1991;55:349–370. - PMC - PubMed

MeSH terms