. 2001 Jun 19;98(13):7307-12.
doi: 10.1073/pnas.111150598. Epub 2001 Jun 5.

Corneal collagen fibril structure in three dimensions: Structural insights into fibril assembly, mechanical properties, and tissue organization

Affiliations

Corneal collagen fibril structure in three dimensions: Structural insights into fibril assembly, mechanical properties, and tissue organization

D F Holmes et al. Proc Natl Acad Sci U S A. .

Abstract

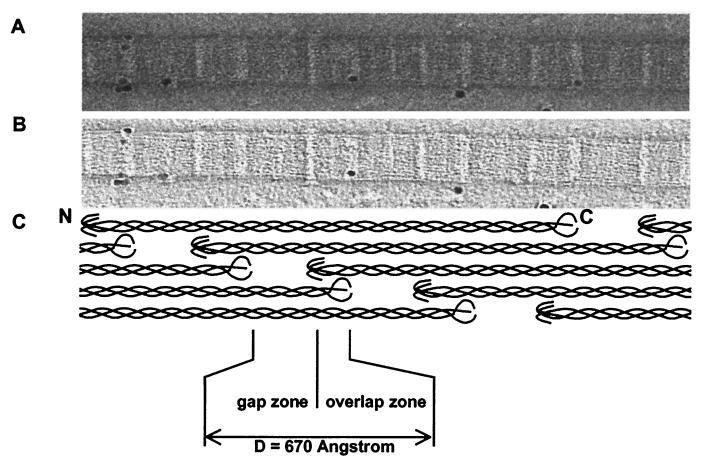
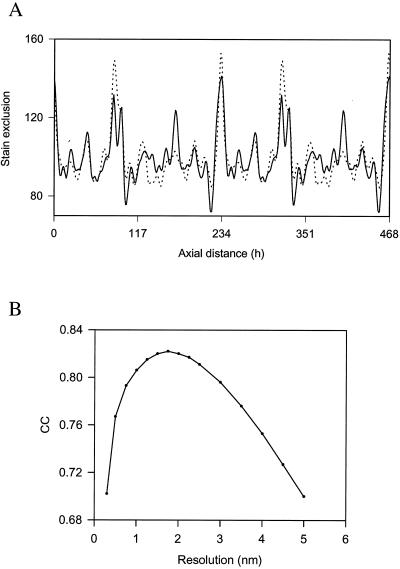
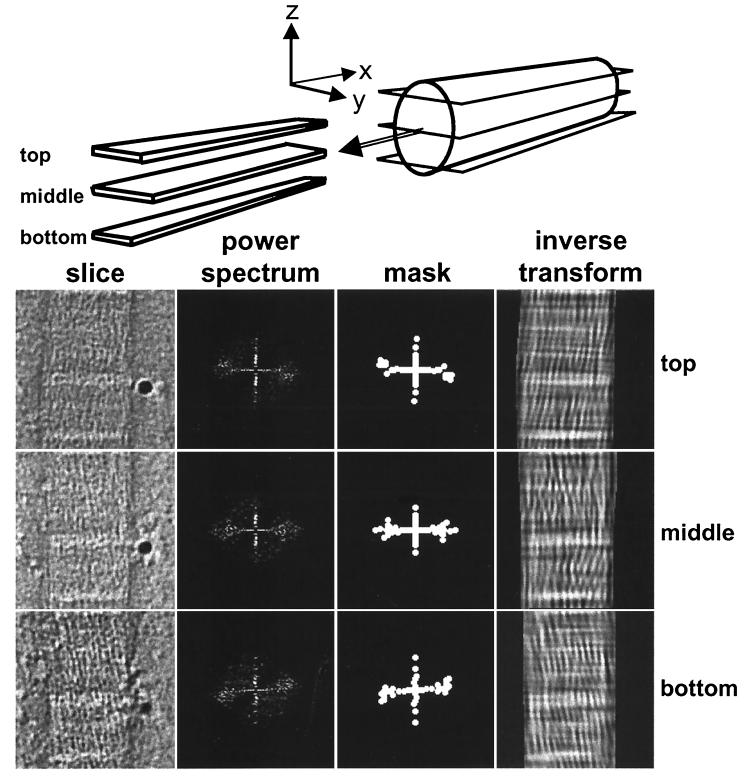
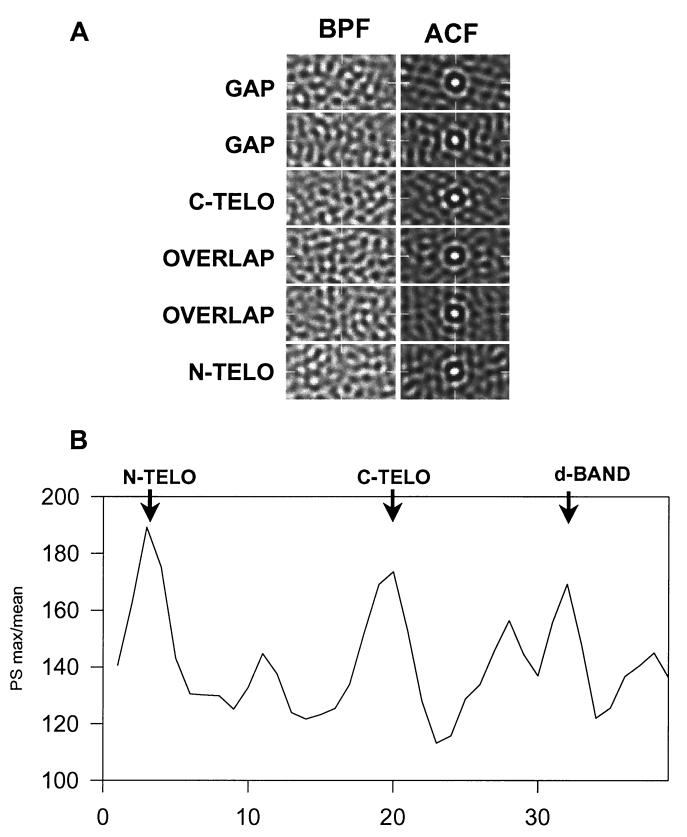
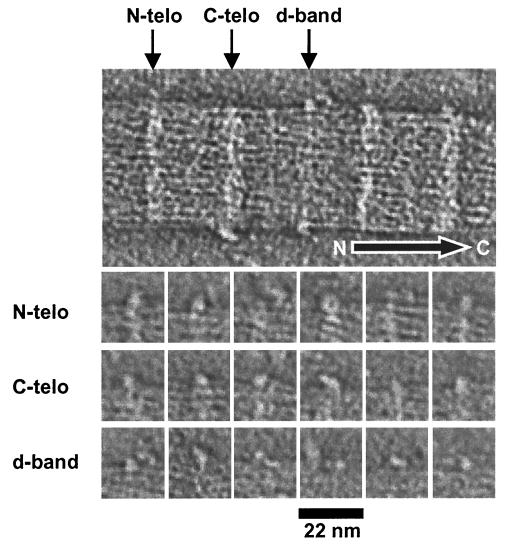
The ability of the cornea to transmit light while being mechanically resilient is directly attributable to the formation of an extracellular matrix containing orthogonal sheets of collagen fibrils. The detailed structure of the fibrils and how this structure underpins the mechanical properties and organization of the cornea is understood poorly. In this study, we used automated electron tomography to study the three-dimensional organization of molecules in corneal collagen fibrils. The reconstructions show that the collagen molecules in the 36-nm diameter collagen fibrils are organized into microfibrils (approximately 4-nm diameter) that are tilted by approximately 15 degrees to the fibril long axis in a right-handed helix. An unexpected finding was that the microfibrils exhibit a constant-tilt angle independent of radial position within the fibril. This feature suggests that microfibrils in concentric layers are not always parallel to each other and cannot retain the same neighbors between layers. Analysis of the lateral structure shows that the microfibrils exhibit regions of order and disorder within the 67-nm axial repeat of collagen fibrils. Furthermore, the microfibrils are ordered at three specific regions of the axial repeat of collagen fibrils that correspond to the N- and C-telopeptides and the d-band of the gap zone. The reconstructions also show macromolecules binding to the fibril surface at sites that correspond precisely to where the microfibrils are most orderly.


Figures

Figure 1
Figure 1
AET reconstruction of corneal collagen fibrils. Electron microscope data on negatively stained corneal collagen fibrils. Images were collected by using a TVIPS for AET on a Philips CM200 FEG at an instrumental magnification of 20 K with a total accumulated dose of 616 electrons per Å−2. (A) A single image at 0° from a −70°- to +70°-tilt series. (B) A virtual slice from the three-dimensional reconstruction showing a central section of the fibril shown in A. (C) Schematic representation of the axial arrangement of molecules in the D-periodic fibril, shown at the same magnification and in axial alignment with the images in A and B.
Figure 2
Figure 2
Resolution in the axial structure. (A) Comparison of a theoretical (dotted line) stain-exclusion pattern with experimental (solid line) data from interior 4-nm-thick slices of the three-dimensional reconstruction, averaged over 20 D-periods. The theoretical pattern is based on the known axial structure of the triple helix and established correlation between stain exclusion and “bulkiness” (= volume/chain length) of each amino acid residue (43). The gap structure has been modeled in a compact form thereby removing the gap–overlap contrast in the fibril interior. The contributions of the N- and C-telopeptides have been calculated by using contraction factors, with respect to the residue spacing in the triple helix, of 0.3 and 0.7, respectively. The theoretical pattern has been smoothed to a resolution of 18 Å. h, axial residue spacing where D (67 nm) = 234 residues. (B) Plot of cross correlation coefficient (CC) between the experimental stain-exclusion pattern and the resolution of the smoothed theoretical pattern.
Figure 3
Figure 3
Visualization of microfibrillar structure. Longitudinal virtual slices (xy) through the three-dimensional reconstruction sampling the fibril in the top, middle, and bottom zones, as indicated schematically. The raw slice images are shown together with the power spectra masks that include the main peak intensities and the Fourier-filtered images by using these masks. A filamentous substructure is apparent in the original images and this is enhanced after filtering. The filaments show a predominant tilt of about +15° and −15° in the upper and lower zones of the fibril, respectively. The tilt direction changes rapidly in the central zone. Both tilt components can be seen in the middle slice.
Figure 4
Figure 4
The lateral arrangement of microfibrils demonstrates a dependence on axial position within the D-period. (A) Typical transverse slice (yz) images after band-pass filtering (BPF) (1/2.5–1/8 nm−1) and corresponding autocorrelation functions (ACF) are shown. The ACFs show first-order peaks at a spacing of ≈4.1 nm. The appearance of this inner ring varies from diffuse to a hexagonal arrangement of peaks [e.g., C-telopeptides (C-TELO)], which is indicative of regular hexagonal packing of microfibrils. (B) Quantitative measure of lateral order. The maximum peak height/mean intensity of the power spectra was plotted against axial position. The plot is an average over 8 D-periods for an individual fibril. The average D-period is shown in 38 slices. Regions of maximum order occur at the N- and C-telopeptides and at a region in the gap zone that corresponds to the position of the d-band, as defined from stain patterns.
Figure 5
Figure 5
Visualization of surface-bound macromolecules. The upper image is part of a central slice of a three-dimensional reconstruction of a negatively stained collagen fibril, showing macromolecules bound at preferred axial locations along the fibril. The arrow shows the molecular polarity of the fibril. The gallery shows views of 18 individual macromolecules that were bound to N-telopeptides (N-telo), C-telopeptides (C-telo), and the gap zone. Nine macromolecules are shown for each location. Note the doughnut (ring-shaped) structure at the N-telopeptides and the tadpole-shaped molecule bound to the C-telopeptides. The macromolecules bound to the gap zone were smaller and more conspicuous than those bound to the telopeptides.

References

    1. Wess T J, Hammersley A P, Wess L, Miller A. J Struct Biol. 1998;122:92–100. - PubMed
    1. Eikenberry E F, Childs B, Sheren S B, Parry D A, Craig A S, Brodsky B. J Mol Biol. 1984;176:261–277. - PubMed
    1. Hulmes D J S, Miller A. Nature (London) 1979;282:878–880. - PubMed
    1. Fraser R D B, MacRae T P, Miller A. J Mol Biol. 1987;193:115–125. - PubMed
    1. Miller A, Tocchetti D. Int J Biol Macromol. 1981;3:9–18.

Publication types

LinkOut - more resources