. 2001 Jun 19;98(13):7522-7.
doi: 10.1073/pnas.121164498. Epub 2001 Jun 5.

Tissue-specific overexpression of lipoprotein lipase causes tissue-specific insulin resistance

Affiliations

Tissue-specific overexpression of lipoprotein lipase causes tissue-specific insulin resistance

J K Kim et al. Proc Natl Acad Sci U S A. .

Abstract

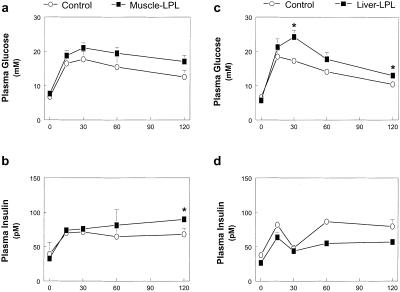
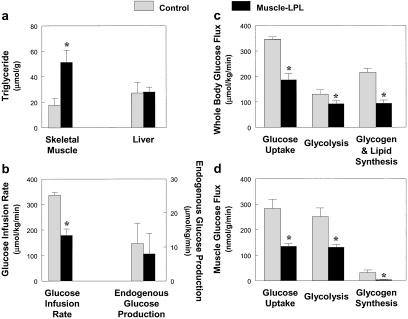
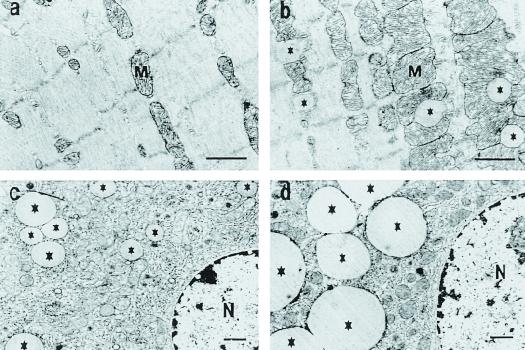
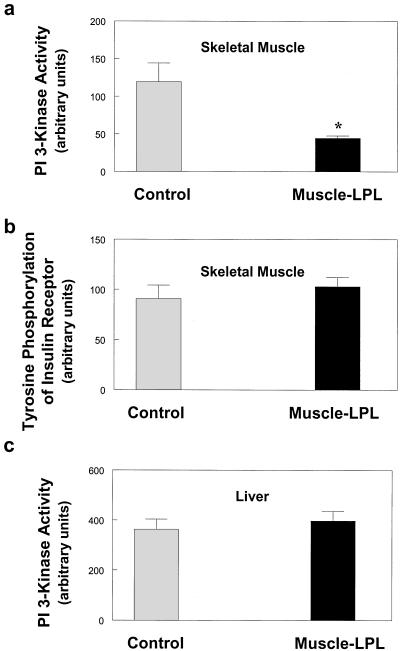
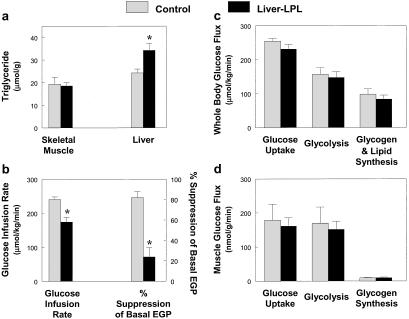
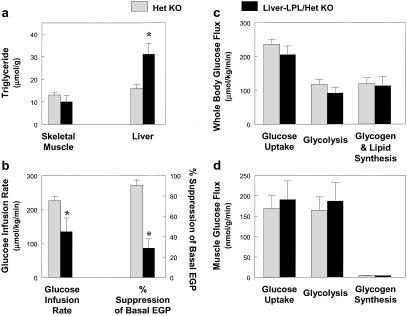
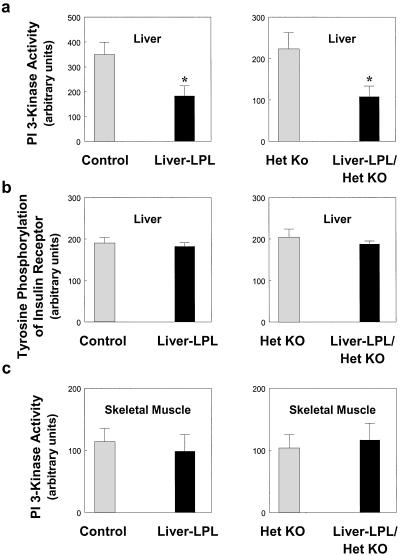
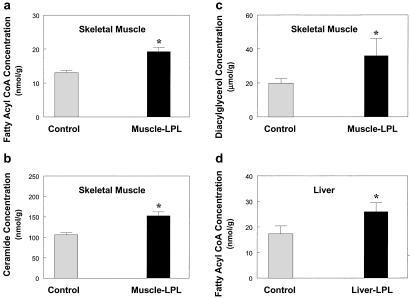
Insulin resistance in skeletal muscle and liver may play a primary role in the development of type 2 diabetes mellitus, and the mechanism by which insulin resistance occurs may be related to alterations in fat metabolism. Transgenic mice with muscle- and liver-specific overexpression of lipoprotein lipase were studied during a 2-h hyperinsulinemic-euglycemic clamp to determine the effect of tissue-specific increase in fat on insulin action and signaling. Muscle-lipoprotein lipase mice had a 3-fold increase in muscle triglyceride content and were insulin resistant because of decreases in insulin-stimulated glucose uptake in skeletal muscle and insulin activation of insulin receptor substrate-1-associated phosphatidylinositol 3-kinase activity. In contrast, liver-lipoprotein lipase mice had a 2-fold increase in liver triglyceride content and were insulin resistant because of impaired ability of insulin to suppress endogenous glucose production associated with defects in insulin activation of insulin receptor substrate-2-associated phosphatidylinositol 3-kinase activity. These defects in insulin action and signaling were associated with increases in intracellular fatty acid-derived metabolites (i.e., diacylglycerol, fatty acyl CoA, ceramides). Our findings suggest a direct and causative relationship between the accumulation of intracellular fatty acid-derived metabolites and insulin resistance mediated via alterations in the insulin signaling pathway, independent of circulating adipocyte-derived hormones.


Figures

Figure 1
Figure 1
i.p. glucose tolerance tests. (a) Plasma glucose concentrations in the control (○) and muscle-LPL (■) groups. (b) Plasma insulin concentrations in the control (○) and muscle-LPL (■) groups. (c) Plasma glucose concentrations in the control (○) and liver-LPL (■) groups. (d) Plasma insulin concentrations in the control (○) and liver-LPL (■) groups. Plasma insulin concentrations were taken from two liver-LPL and two corresponding control mice because of a difficulty in blood sampling during the i.p. glucose tolerance tests. Values are means ± SE for four experiments. *, P < 0.05 vs. control group.
Figure 2
Figure 2
Whole-body and skeletal muscle glucose flux in vivo in the control (open bars) and muscle-LPL (filled bars) mice. (a) Intracellular triglyceride concentration in skeletal muscle (Left) and liver (Right). (b) Steady-state glucose infusion rate (Left), obtained from averaged rates of 90–120 min of hyperinsulinemic–euglycemic clamps. Insulin-stimulated rates of EGP (Right). (c) Insulin-stimulated whole-body glucose uptake, glycolysis, and glycogen/lipid synthesis in vivo. (d) Insulin-stimulated glucose uptake, glycolysis, and glycogen synthesis in skeletal muscle in vivo. Values are means ± SE for 6≈7 experiments. *, P < 0.05 vs. control group.
Figure 3
Figure 3
Electron microscopy of skeletal muscle and liver. Skeletal muscle of control (a) and muscle-LPL mice (b). Liver of control (c) and liver-LPL mice (d). (Bars, 1 μm.) *, lipid droplets, M, mitochondria, N, nucleus.
Figure 4
Figure 4
Insulin signaling in the skeletal muscle and liver of control (open bars) and muscle-LPL (filled bars) mice. (a) IRS-1-associated PI 3-kinase activity in skeletal muscle. (b) Tyrosine phosphorylation of insulin receptor in skeletal muscle. (c) IRS-2-associated PI 3-kinase activity in liver. Values are means ± SE for 6≈7 experiments. *, P < 0.05 vs. control group.
Figure 5
Figure 5
Whole-body and skeletal muscle glucose flux in vivo in the control (open bars) and liver-LPL (filled bars) mice. (a) Intracellular triglyceride concentration in skeletal muscle (Left) and liver (Right). (b) Steady-state glucose infusion rate (Left). Insulin-stimulated percent suppression of basal EGP (Right). (c) Insulin-stimulated whole-body glucose uptake, glycolysis, and glycogen/lipid synthesis in vivo. (d) Insulin-stimulated glucose uptake, glycolysis, and glycogen synthesis in skeletal muscle in vivo. Values are means ± SE for 3≈7 experiments. *, P < 0.05 vs. control group.
Figure 6
Figure 6
Whole-body and skeletal muscle glucose flux in vivo in the het KO (open bars) and liver-LPL/het KO (filled bars) mice. (a) Intracellular triglyceride concentration in skeletal muscle (Left) and liver (Right). (b) Steady-state glucose infusion rate (Left). Insulin-stimulated percent suppression of basal EGP (Right). (c) Insulin-stimulated whole-body glucose uptake, glycolysis, and glycogen/lipid synthesis in vivo. (d) Insulin-stimulated glucose uptake, glycolysis, and glycogen synthesis in skeletal muscle in vivo. Values are means ± SE for 3≈6 experiments. *, P < 0.05 vs. control group.
Figure 7
Figure 7
Insulin signaling in the skeletal muscle and liver of control (open bars) vs. liver-LPL (filled bars) (Left) and het KO (open bars) vs. liver-LPL/het KO (filled bars) (Right) mice. (a) IRS-2-associated PI 3-kinase activity in liver. (b) Tyrosine phosphorylation of insulin receptor in liver. (c) IRS-1-associated PI 3-kinase activity in skeletal muscle. Values are means ± SE for 3≈7 experiments. *, P < 0.05 vs. control group.
Figure 8
Figure 8
Intracellular fatty acid-derived metabolites in the skeletal muscle and liver. (a) Intracellular fatty acyl CoA concentration in skeletal muscle in the control (open bars) and muscle-LPL (filled bars) groups. (b) Intracellular ceramide concentration in skeletal muscle in the control (open bars) and muscle-LPL (filled bars) groups. (c) Intracellular diacylglycerol concentration in skeletal muscle in the control (open bars) and muscle-LPL (filled bars) groups. (d) Intracellular fatty acyl CoA concentration in liver in the control (open bars) and liver-LPL (filled bars) groups. Values are means ± SE for 5≈10 experiments. *, P < 0.05 vs. control group.

References

    1. Shaw J E, Zimmet P Z, McCarty D, Courten M D. Diabetes Care. 2000;23, Suppl. 2:B5–B10. - PubMed
    1. McGarry J D. Science. 1992;258:766–770. - PubMed
    1. Hotamisligil G S, Shargill N S, Spiegelman B M. Science. 1993;259:87–91. - PubMed
    1. Hotamisligil G S. J Int Med. 1999;245:621–625. - PubMed
    1. Kahn C R, Chen L, Cohen S E. J Clin Invest. 2000;106:1305–1307. - PMC - PubMed

Publication types

MeSH terms

LinkOut - more resources