. 2001 Jun 19;98(13):7295-300.
doi: 10.1073/pnas.121172298. Epub 2001 Jun 5.

Kinetic proofreading models for cell signaling predict ways to escape kinetic proofreading

Affiliations

Kinetic proofreading models for cell signaling predict ways to escape kinetic proofreading

W S Hlavacek et al. Proc Natl Acad Sci U S A. .

Abstract

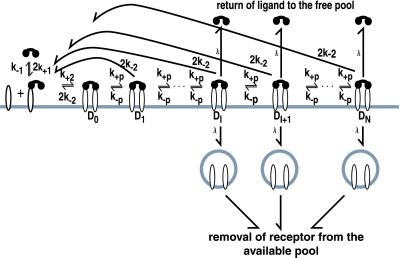
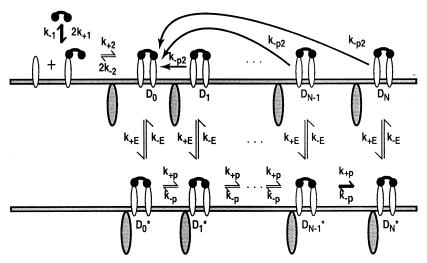
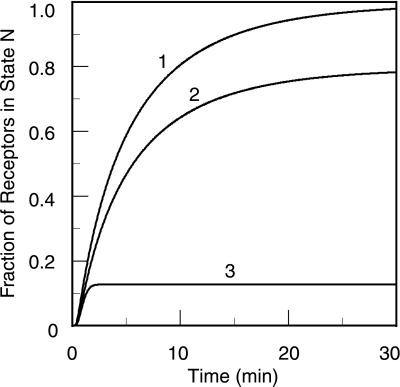
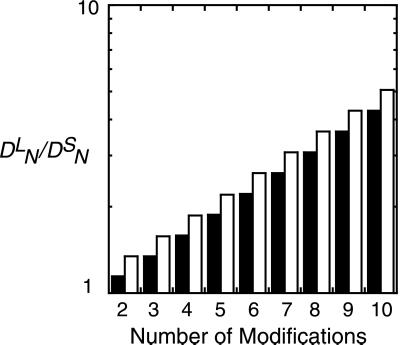
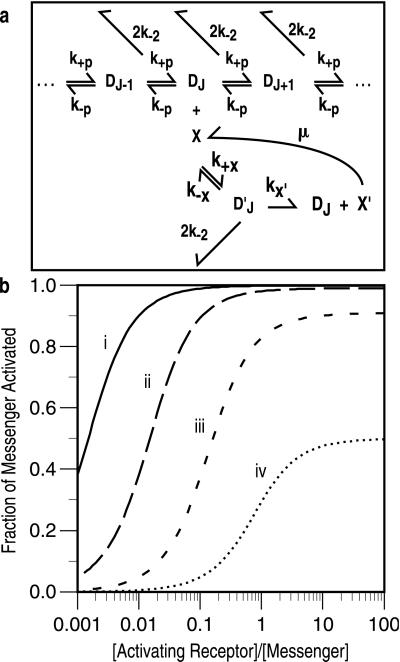
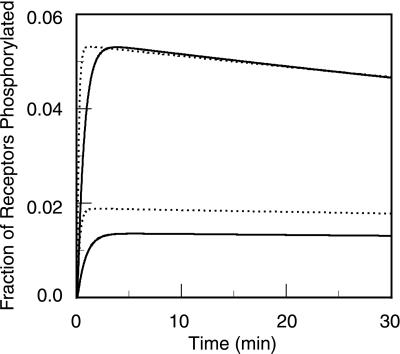
In the context of cell signaling, kinetic proofreading was introduced to explain how cells can discriminate among ligands based on a kinetic parameter, the ligand-receptor dissociation rate constant. In the kinetic proofreading model of cell signaling, responses occur only when a bound receptor undergoes a complete series of modifications. If the ligand dissociates prematurely, the receptor returns to its basal state and signaling is frustrated. We extend the model to deal with systems where aggregation of receptors is essential to signal transduction, and present a version of the model for systems where signaling depends on an extrinsic kinase. We also investigate the kinetics of signaling molecules, "messengers," that are generated by aggregated receptors but do not remain associated with the receptor complex. We show that the extended model predicts modes of signaling that exhibit kinetic discrimination for some range of parameters but for other parameter values show little or no discrimination and thus escape kinetic proofreading. We compare model predictions with experimental data.


Figures

Figure 1
Figure 1
The IK model. A bivalent ligand binds to monovalent receptors, aggregating pairs of receptors into dimers. The single site forward and reverse rate constants for ligand/receptor binding are k+1 and k−1 when the ligand binds singly, from solution, and k+2 and k−2 for the surface reaction when the second site on a singly bound bivalent ligand binds to a second receptor. Receptor dimers undergo a sequence of reversible modifications, with forward and reverse rate constants k+p and kp. The final activated state is numbered N. The model allows for the possibility that, beyond some level of modification, dimers are subject to down-regulation. Dimers in states iI are removed at a rate λ.
Figure 2
Figure 2
The EK model. Dimers must associate with a surface-associated cytoplasmic enzyme before any further modifications can occur. Association with the enzyme is reversible. When the enzyme is present, dimers undergo reversible modifications. If the enzyme dissociates from a modified dimer, the modifications are reversed rapidly. Down-regulation and dissociation of dimers are omitted from the figure. When dimers are lost, associated enzyme is not down-regulated but returns to the pool of free enzyme.
Figure 3
Figure 3
Predicted kinetics of receptor modification when binding is irreversible (k−1 = k−2 = 0). The curves were obtained by solving numerically the set of ordinary differential equations that describe the EK model (see Models and Results). Plotted is the fraction of receptors in dimers that have undergone nine modifications, for the following cases: (i) excess initiating enzyme and kp = 0; (ii) excess initiating enzyme and kp = 0.01 s−1; (iii) limiting initiating enzyme and kp = 0.01 s−1. Other parameters are given in Table 1 and discussed in Parameter Estimates Used in the Simulations.
Figure 4
Figure 4
Kinetic discrimination as a function of N, the number of modifications required to produce a signaling state. Two ligands, referred to as long (L) and short (S) lived, have the same equilibrium binding and aggregation constants, i.e. Kformula image = Kformula image and Kformula image = Kformula image, so that, in the steady state (λ = 0), they produce the same total concentration of dimers. Their rate constants differ by a factor of two, with kformula image = 2kformula image and kformula image = 2kformula image. k−1 = k−2 for both ligands. Plotted is the ratio of the concentrations in the Nth state, Dformula image/Dformula image, a measure of discrimination, vs. N. The filled bars correspond to excess initiating enzyme (ETRT) and the open bars to limiting enzyme (ET = 0.1RT). Parameters are given in Table 1.
Figure 5
Figure 5
(a) Production of messenger. Dimers in the Jth state of modification mediate production or activation of an intracellular “messenger.” The Jth dimer (DJ) acts as an enzyme, and the inactive messenger (X) as the substrate. The dimer and the inactive messenger combine reversibly to form a complex (Dformula image), which then yields the activated messenger (X′) and the activating dimer. Active messenger decays back to the inactive form at a rate μ. In the case of the EK model (Fig. 2), we assume that both forms of the Jth dimer (i.e., associated or not associated with an initiating enzyme) can activate messenger. (b) Activated messenger as a function of the steady-state level of activating receptor dimers. The curves depend only on two parameters, kx/μ and XT/Km, where XT is the total concentration of messenger and Km = (kx + kx′ + 2k−2)/k+x. When k−2 = 0, Km is the usual Michaelis-Menten constant. For these plots XT/Km = 1 and kx/μ has the values: (i) 1000, (ii) 100, (iii) 10, and (iv) 1. The plots are identical for the IK and EK models.
Figure 6
Figure 6
Predicted kinetics of phosphorylation of receptor tyrosines, for two ligands with different dissociation rate constants, at two concentrations (LT): (i) k−1 = k−2 = 0.05, LT = 10−9 M (solid upper curve); (ii) k−1 = k−2 = 0.05, LT = 2 × 10⁻¹⁰ M (dotted upper curve); (iii) k−1 = k−2 = 0.11, LT = 10−8 M (solid lower curve); (iv) k−1 = k−2 = 0.11, LT = 2 × 10⁻⁹ M (dotted lower curve). Additional parameters are given in Table 1. Time courses are simulated by using the EK model. Receptor phosphorylation is taken to be the first modification that dimers undergo. Plotted is the fraction of all receptors that are modified (i.e., receptors in all dimers except D0 and D*0 in Fig. 2).

Comment in

References

    1. McKeithan T W. Proc Natl Acad Sci USA. 1995;92:5042–5046. - PMC - PubMed
    1. Lyons D S, Lieberman S A, Hampl J, Boniface J J, Chien Y, Berg L J, Davis M M. Immunity. 1996;5:53–61. - PubMed
    1. Torigoe C, Inman J K, Metzger H. Science. 1998;281:568–572. - PubMed
    1. Liu Z-J, Haleem-Smith H, Chen H, Metzger H. Proc Natl Acad Sci USA. 2001;98:7289–7294. . (First Published May 22, 2001; 10.1073/pnas.121171998) - PMC - PubMed
    1. Keegan A D, Paul W E. Immunol Today. 1992;13:63–68. - PubMed

Publication types

LinkOut - more resources