Comparative Study
. 2001 Jun 19;98(13):7140-5.
doi: 10.1073/pnas.121177598. Epub 2001 Jun 5.

Global modulation of cellular transcription by human cytomegalovirus is initiated by viral glycoprotein B

Affiliations
Comparative Study

Global modulation of cellular transcription by human cytomegalovirus is initiated by viral glycoprotein B

K A Simmen et al. Proc Natl Acad Sci U S A. .

Abstract

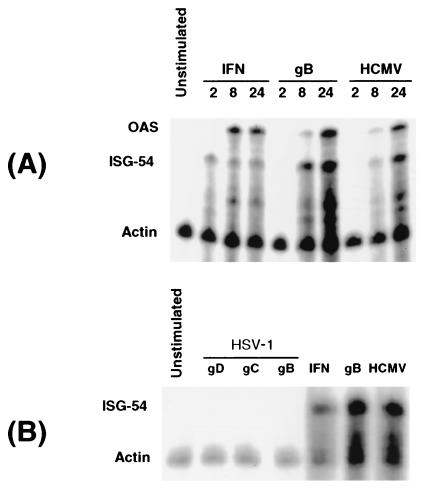
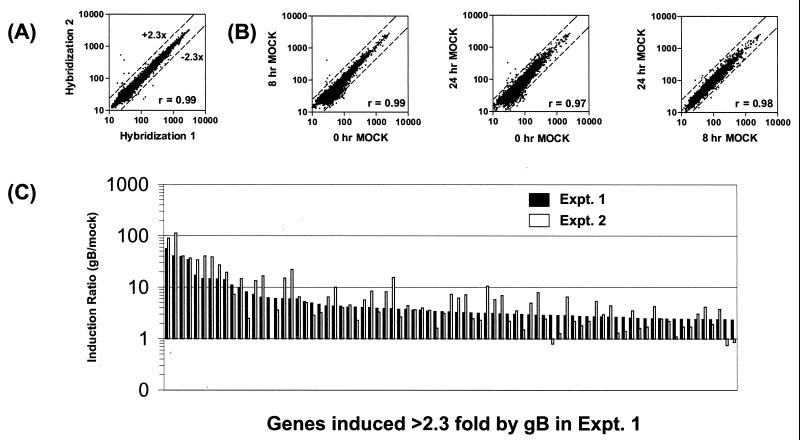
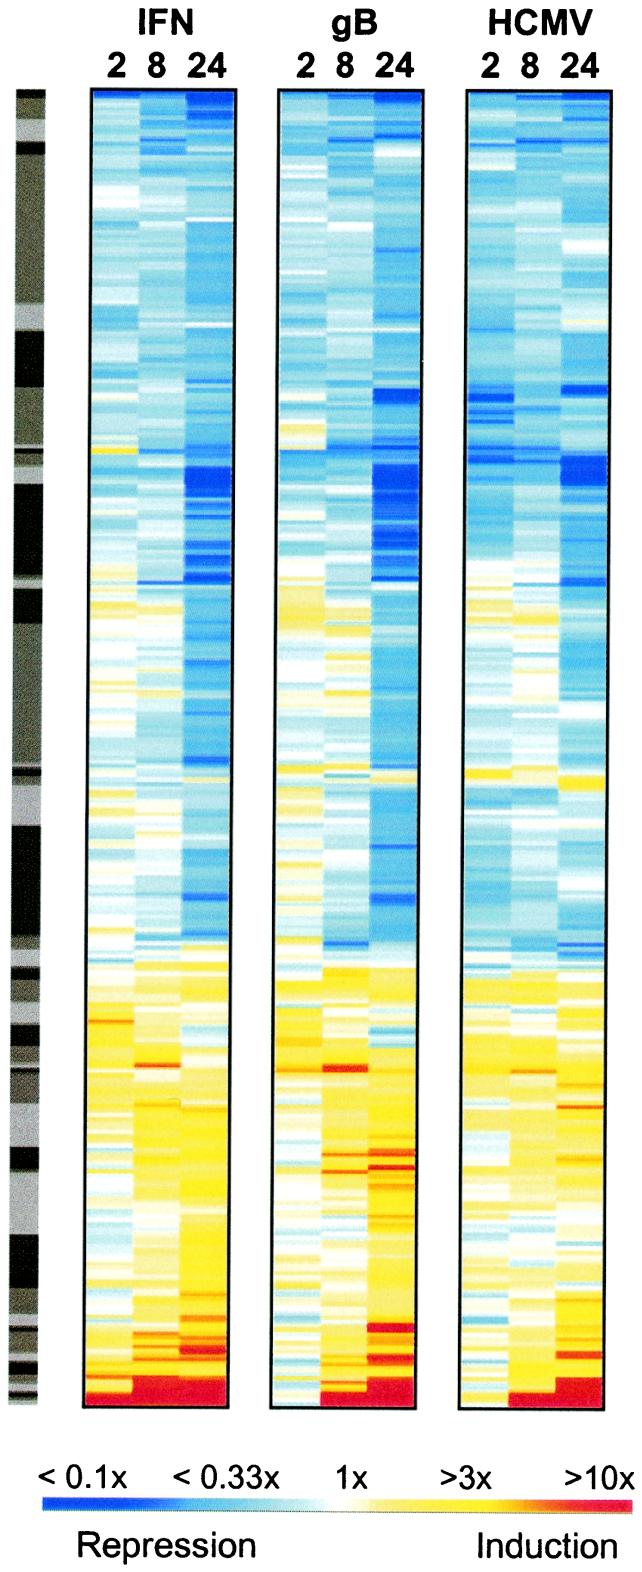
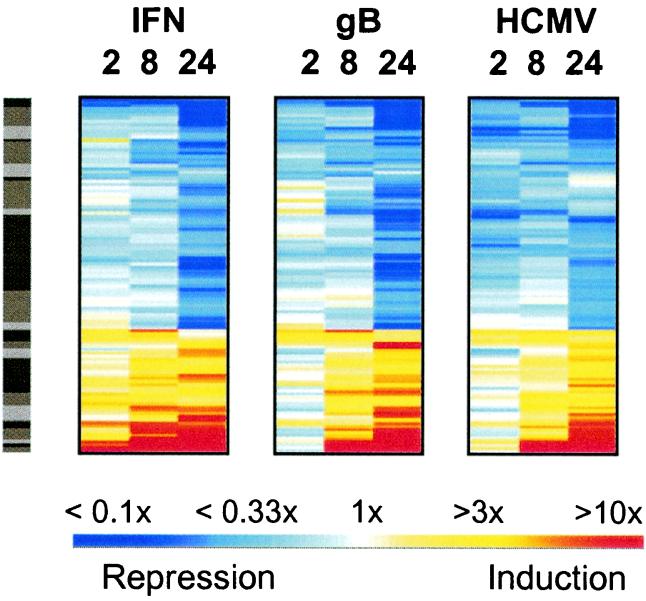
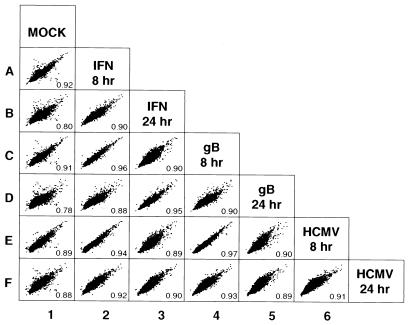
Human cytomegalovirus (HCMV) infection alters the expression of many cellular genes, including IFN-stimulated genes (ISGs) [Zhu, H., Cong, J.-P., Mamtora, G., Gingeras, T. & Shenk, T. (1998) Proc. Natl. Acad. Sci. USA 95, 14470-14475]. By using high-density cDNA microarrays, we show that the HCMV-regulated gene expression profile in fibroblasts does not differ substantially from the response generated by IFN. Furthermore, we identified the specific viral component triggering this response as the envelope glycoprotein B (gB). Cells treated with gB, but not other herpesviral glycoproteins, exhibited the same transcriptional profile as HCMV-infected cells. Thus, the interaction of gB with its as yet unidentified cellular receptor is the principal mechanism by which HCMV alters cellular gene expression early during infection. These findings highlight a pioneering paradigm for the consequences of virus-receptor interactions.


Figures

Figure 1
Figure 1
Specificity of viral induction of ISGs. (A) HFFs were incubated with recombinant Type I IFNs (100 units/ml), recombinant HCMV gB (13 μg/ml), or HCMV [Ad169 strain, at a multiplicity of infection (MOI) of 2], and RNA samples were harvested at 2, 8, and 24 h posttreatment. The samples were analyzed by RNase protection with radiolabeled probes to oligo adenylate synthetase (OAS), ISG of 54 kDa (ISG-54), and actin. The protected samples were separated by denaturing gel electrophoresis and detected by using a phosphor imager (GS-525; Bio-Rad). (B) HFF cells were incubated with purified recombinant forms of HSV glycoproteins (gD, gC, and gB, at 13 μg/ml), recombinant Type I IFNs (100 units/ml), HCMV gB (13 μg/ml), and HCMV (MOI = 2) for 8 h. RNase protection analysis using probes to ISG-54 and actin was performed on RNA from treated samples, as described above. The apparent increase in actin signal seen after both HCMV and gB treatments was because of degradation of protected ISG-54 probes, which are more abundant in those samples with elevated ISG-54 message.
Figure 2
Figure 2
Microarray validation. (A) Cy3-labeled cDNA probes prepared from HFF total RNA were hybridized to two identical sets of microarrays harboring 8,942 genes. After scanning and normalization, the mean signal intensities (in arbitrary fluorescence units) from each gene were compared by using scatter-plot linear regression analysis. Greater than 99.8% of genes change less than 2.3-fold, as delineated by the dashed lines. The pair-wise similarity of gene-expression profiles was measured by the correlation coefficient (r value). (B) Gene expression of mock-treated fibroblasts at 0, 8, or 24 h was analyzed by scatter-plot analysis of signal intensities. Three comparisons, 0/8 h, 0/24 h, and 8/24 h, are shown. With few exceptions, changes were less than 2.3-fold or displayed a low-intensity signal. As a result, the r values are higher than 0.97 in the comparisons, indicating that the changes induced by mock treatment are not significant. (C) Reproducible induction of individual genes in two independent gB treatments. The induction ratios (relative to the mock) of genes induced >2.3-fold by a 24-h gB treatment in experiment (Expt.) 1 are plotted with their corresponding ratios from an independent 24-h gB treatment (Expt. 2). (Genes and ratios are provided in Table 1, which is published as supplemental data on the PNAS web site, www.pnas.org.) The genes are plotted along the x axis in order of decreasing induction in Expt. 1.
Figure 3
Figure 3
Cluster analysis of genes changing in response to IFN, gB, or HCMV infection. Genes changing more than 2.3-fold in any one of the treatments were selected for hierarchical cluster analysis (using logarithm e transforms of the ratios) with the OMNIVIZ PRO software package (OmniViz, Maynard, MA), using the CorScape visualization. Depicted ratios were derived by comparing hybridization signals obtained from virus-, gB-, or IFN-treated cells to those of mock treatments. All ratios for which the mock intensity had a coefficient of variation of >50% were removed. This analysis yielded a set of 441 genes. Each gene is represented as a horizontal strip, with the color representing the relative linear induction or repression ratio as depicted by the color scale. The distribution of the genes into 50 clusters (shown in the gray sidebar) was generated with OMNIVIZ PRO, and the clusters are ordered similarly according to the hierarchical correlation algorithm used. The fluorescence intensities and ratios (relative to the mock) are provided in Table 2, which is published as supplemental data on the PNAS web site.
Figure 4
Figure 4
Stringent coregulation of genes early in viral infection. From the cluster view in Fig. 3, a second more stringent filter was applied to select only those genes changing >2.3-fold in response to all three treatments (in at least 1 of the 3 time points for each treatment). These criteria selected 112 of the 441 genes, and these were reclustered into 25 groups by using the logarithm e-transformed ratios as in Fig. 3 (using the OMNIVIZ PRO CorScape view).
Figure 5
Figure 5
Global analysis of fibroblast gene expression in response to IFN, gB, or HCMV infection. Intensity data from all of the cDNAs on the microarrays obtained at 8 and 24 h were log-transformed, and scatter plots were generated to assess differential gene expression between samples. Pair-wise similarity of gene-expression profiles was measured by the correlation coefficient; r values are indicated in the lower right corner of each scatter plot. Plots and calculations were made by using S-PLUS (http://www.mathsoft.com). The 2-h time points were omitted from this analysis because relatively few genes changed at this early time point.

References

    1. Lockhart D J, Dong H, Byrne M C, Follettie M T, Gallo M V, Chee M S, Mittmann M, Wang C, Kobayashi M, Horton H, Brown E L. Nat Biotechnol. 1996;14:1675–1680. - PubMed
    1. Chee M, Yang R, Hubbell E, Berno A, Huang X C, Stern D, Winkler J, Lockhart D J, Morris M S, Fodor S P A. Science. 1996;274:610–614. - PubMed
    1. Zhu H, Cong J-P, Shenk T. Proc Natl Acad Sci USA. 1997;94:13985–13990. - PMC - PubMed
    1. Zhu H, Cong J-P, Mamtora G, Gingeras T, Shenk T. Proc Natl Acad Sci USA. 1998;95:14470–14475. - PMC - PubMed
    1. Der S D, Zhou A, Williams B R G, Silverman R H. Proc Natl Acad Sci USA. 1998;95:15623–15628. - PMC - PubMed

Publication types

Associated data