

doi: 10.1073/pnas.131199098.
Mapping of complex regulatory elements by pufferfish/zebrafish transgenesis
Affiliations
- PMID: 11390989
- PMCID: PMC34387
- DOI: 10.1073/pnas.131199098
Item in Clipboard
Mapping of complex regulatory elements by pufferfish/zebrafish transgenesis
Proc Natl Acad Sci U S A.
.
No abstract available
Figures
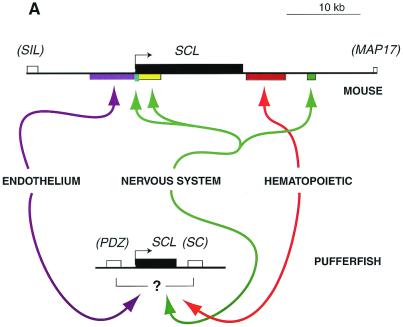
Genome compression in Fugu. (A)
Comparison between the murine and pufferfish SCL genes.
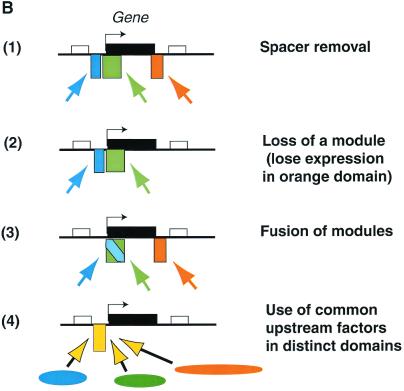
(B) Three hypothetical ways that compression of the
genome could affect regulatory sequence organization: (1) shrinking
spacer regions between tissue-specific modules (no simplification) vs.
simplification by (2) deletion of selected modules, (3) fusion of
modules, or (4) broadening the activity of an upstream regulator for
use in different tissues. In both A and
B, rectangles above the lines represent genes (exons and
introns together), with the gene of interest shown in black. Colored
rectangles below the lines show the locations of enhancer modules that
drive expression in different tissues. Colored arrows indicate the
tissue-specific transcription factors that engage these respective
enhancer modules. In B, three hypothetical tissues, and
the transcription factors and modules active in each tissue
respectively, are coded as orange, blue, and green.
Genome compression in Fugu. (A)
Comparison between the murine and pufferfish SCL genes.
(B) Three hypothetical ways that compression of the
genome could affect regulatory sequence organization: (1) shrinking
spacer regions between tissue-specific modules (no simplification) vs.
simplification by (2) deletion of selected modules, (3) fusion of
modules, or (4) broadening the activity of an upstream regulator for
use in different tissues. In both A and
B, rectangles above the lines represent genes (exons and
introns together), with the gene of interest shown in black. Colored
rectangles below the lines show the locations of enhancer modules that
drive expression in different tissues. Colored arrows indicate the
tissue-specific transcription factors that engage these respective
enhancer modules. In B, three hypothetical tissues, and
the transcription factors and modules active in each tissue
respectively, are coded as orange, blue, and green.
Comment on
-
Regulation of the stem cell leukemia (SCL) gene: a tale of two fishes.Proc Natl Acad Sci U S A. 2001 Jun 5;98(12):6747-52. doi: 10.1073/pnas.101532998. Epub 2001 May 29. Proc Natl Acad Sci U S A. 2001. PMID: 11381108 Free PMC article.
References
MeSH terms
Substances
LinkOut - more resources
Full Text Sources
Other Literature Sources
