. 2001 Jun 5;98(12):6641-5.
doi: 10.1073/pnas.111083998.

An approach to three-dimensional structures of biomolecules by using single-molecule diffraction images

Affiliations

An approach to three-dimensional structures of biomolecules by using single-molecule diffraction images

J Miao et al. Proc Natl Acad Sci U S A. .

Abstract

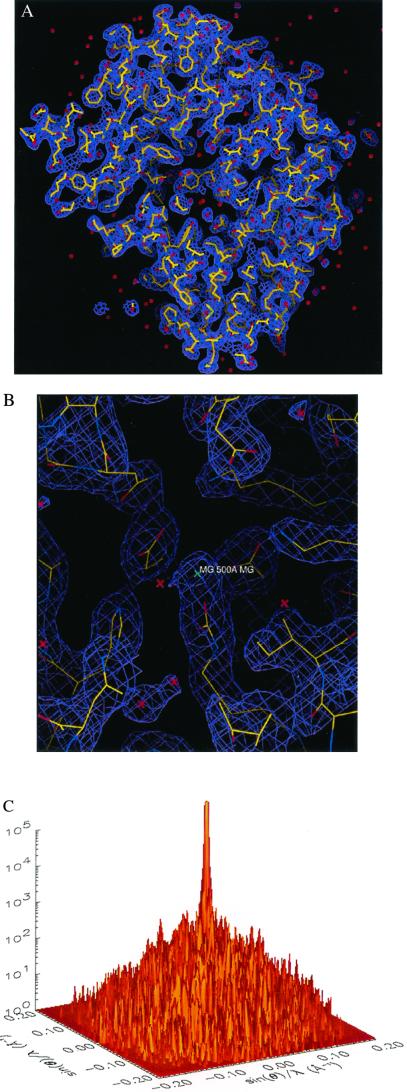
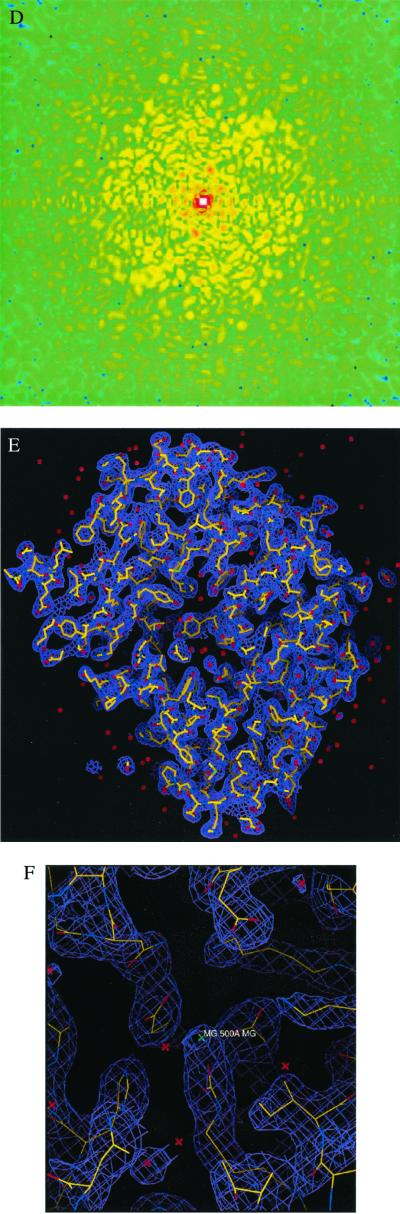
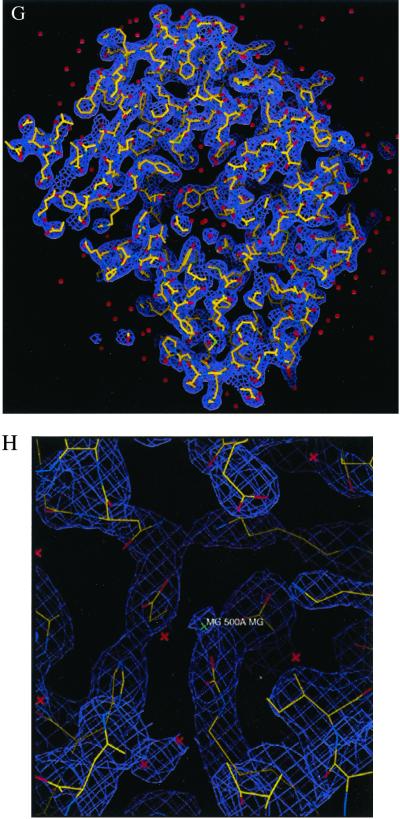
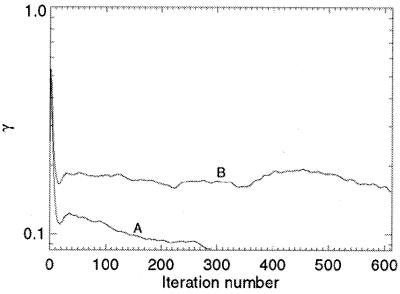
We describe an approach to the high-resolution three-dimensional structural determination of macromolecules that utilizes ultrashort, intense x-ray pulses to record diffraction data in combination with direct phase retrieval by the oversampling technique. It is shown that a simulated molecular diffraction pattern at 2.5-A resolution accumulated from multiple copies of single rubisco biomolecules, each generated by a femtosecond-level x-ray free electron laser pulse, can be successfully phased and transformed into an accurate electron density map comparable to that obtained by more conventional methods. The phase problem is solved by using an iterative algorithm with a random phase set as an initial input. The convergence speed of the algorithm is reasonably fast, typically around a few hundred iterations. This approach and phasing method do not require any ab initio information about the molecule, do not require an extended ordered lattice array, and can tolerate high noise and some missing intensity data at the center of the diffraction pattern. With the prospects of the x-ray free electron lasers, this approach could provide a major new opportunity for the high-resolution three-dimensional structure determination of single biomolecules.


Figures

Figure 1
Figure 1
3D structural determination of single rubisco molecules utilizing a simulated X-FEL and direct phase retrieval by the oversampling technique. (A) Stereoview of the 3D electron density map of the rubisco molecule (contoured at two sigma), on which the refined atomic model of the rubisco molecule is superimposed. The red dots represent the location of water molecules. (B) The active site with a Mg(II). (C) One section (kz = 0) of the 3D diffraction pattern processed from 106 identical copies of the rubisco molecules with Poisson noise added (RI = 9.7%) and 3 × 3 × 3 pixel intensity removed. The edge of the diffraction pattern corresponds to 2.5-Å resolution. We assume here a 100% quantum efficiency for the detector. (D) Top view of C, where the central white area represents the intensity removed. (E) Stereoview of the 3D electron density map of the rubisco molecule (contoured at two sigma), reconstructed from C, on which the same atomic model is superimposed. (F) The active site reconstructed from C. (G) The 3D electron density map of the rubisco molecule (contoured at two sigma) reconstructed from the 3D diffraction pattern of 3 × 10⁵ identical copies of the rubisco molecules, with Poisson noise added (RI = 16.6%) and central 3 × 3 × 3 pixel intensity removed. (H) The reconstructed active site corresponding to G.
Figure 1
Figure 1
3D structural determination of single rubisco molecules utilizing a simulated X-FEL and direct phase retrieval by the oversampling technique. (A) Stereoview of the 3D electron density map of the rubisco molecule (contoured at two sigma), on which the refined atomic model of the rubisco molecule is superimposed. The red dots represent the location of water molecules. (B) The active site with a Mg(II). (C) One section (kz = 0) of the 3D diffraction pattern processed from 106 identical copies of the rubisco molecules with Poisson noise added (RI = 9.7%) and 3 × 3 × 3 pixel intensity removed. The edge of the diffraction pattern corresponds to 2.5-Å resolution. We assume here a 100% quantum efficiency for the detector. (D) Top view of C, where the central white area represents the intensity removed. (E) Stereoview of the 3D electron density map of the rubisco molecule (contoured at two sigma), reconstructed from C, on which the same atomic model is superimposed. (F) The active site reconstructed from C. (G) The 3D electron density map of the rubisco molecule (contoured at two sigma) reconstructed from the 3D diffraction pattern of 3 × 10⁵ identical copies of the rubisco molecules, with Poisson noise added (RI = 16.6%) and central 3 × 3 × 3 pixel intensity removed. (H) The reconstructed active site corresponding to G.
Figure 2
Figure 2
The convergence of the reconstruction from the 3D diffraction pattern (A) of 106 identical copies of the rubisco molecules and (B) of 3 × 10⁵ identical copies of the rubisco molecules.

Comment in

References

    1. Bottcher B, Wynne S A, Crowther R A. Nature (London) 1997;386:88–91. - PubMed
    1. Gabashvili I S, Agrawal R K, Spahn C M T, Grassucci R A, Svergun D I, Frank J, Penczek P. Cell. 2000;100:537–549. - PubMed
    1. Winick H. J Elec Spec Rel Phenom. 1995;75:1–8.
    1. Wiik B H. Nucleic Instrum Methods Phys Res B. 1997;398:1–8.
    1. Neutze R, Wouts R, Spoel D, Weckert E, Hajdu J. Nature (London) 2000;406:752–757. - PubMed

Publication types

MeSH terms

Substances

LinkOut - more resources