. 2001 Jun;13(6):1453-65.
doi: 10.1105/tpc.13.6.1453.

Internal aluminum block of plant inward K(+) channels

Affiliations

Internal aluminum block of plant inward K(+) channels

K Liu et al. Plant Cell. 2001 Jun.

Abstract

Aluminum (Al) inhibits inward K(+) channels (K(in)) in both root hair and guard cells, which accounts for at least part of the Al toxicity in plants. To understand the mechanism of Al-induced K(in) inhibition, we performed patch clamp analyses on K(in) in guard cells and on KAT1 channels expressed in Xenopus oocytes. Our results show that Al inhibits plant K(in) by blocking the channels at the cytoplasmic side of the plasma membrane. In guard cells, single-channel recording revealed that Al inhibition of K(in) occurred only upon internal exposure. Using both "giant patch" recording and single-channel analyses, we found that Al reduced KAT1 open probability and changed its activation kinetics through an internal membrane-delimited mechanism. We also provide evidence that a Ca(2)+ channel-like pathway that is sensitive to antagonists verapamil and La(3)+ mediates Al entry across the plasma membrane. We conclude that Al enters plant cells through a Ca(2)+ channel-like pathway and inhibits K(+) uptake by internally blocking K(in).


Figures
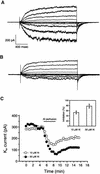
Figure 1.
Figure 1.
Al Inhibition of Kin in Guard Cells. (A) Whole-cell Kin currents recorded in a guard cell protoplast under control conditions. The currents were elicited at membrane potentials from −160 to 80 mV with increments of 20 mV. The holding potential was −50 mV. Both pipette and bath solutions contained 100 mM K+. (B) Whole-cell Kin currents from the same protoplast as in (A) perfused with 50 μM Al in the bath solution. (C) Time courses of Al effects on Kin currents from two protoplasts perfused with 10 μM Al (open circles) and 50 μM Al (closed circles), respectively. Each data point represents the amplitude of whole-cell Kin current at −150 mV at steady state. The Al perfusion period is shown as a horizontal bar. The inset shows the inhibition of steady state Kin current by 10 μM Al (n = 10) and 50 μM Al (n = 10). Error bars indicate ±se.
Figure 2.
Figure 2.
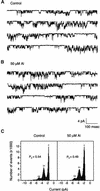
Al Effect on Single-Channel Current of Guard Cell Kin in the Outside-Out Configuration. (A) Single-channel current recorded at a pipette potential of −120 mV in an outside-out patch. The solutions in both sides of membrane patches contained 100 mM K+. (B) Single-channel current from the same patch as in (A) in the presence of 50 μM Al in the bath solution. (C) Open probability (Po) analyses of single-channel currents in (A) and (B). The open probability values were calculated from the ratio of total open time to total recording time. O, open state; C, closed state. The numbers after the Os denote different state levels.
Figure 3.
Figure 3.
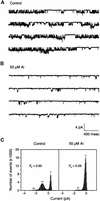
Al Effect on Single-Channel Current of Guard Cell Kin in the Inside-Out Configuration. (A) Single-channel current recorded at a pipette potential of 120 mV in an inside-out patch configuration. The solutions in both sides of the patch contained 100 mM K+. (B) Single-channel current from the same patch as in (A) in the presence of 50 μM Al in the bath solution. The same conditions were used as in (A). The time/current scale is the same in both (A) and (B). (C) Open probability (Po) analyses of single-channel currents in (A) and (B). The open probability values were calculated from the ratio of total open time to total recording time. O, open state; C, closed state. The numbers after the Os denote different state levels.
Figure 4.
Figure 4.
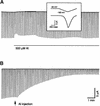
Al Effect on Whole-Oocyte KAT1 Currents. (A) Voltage clamp recording in a KAT1-expressing oocyte. The current traces in the main frame were produced by a number of voltage ramps from a holding potential of −40 mV to the testing potential of −160 mV with 10-sec intervals. Each voltage ramp and corresponding current trace are shown in the inset. The horizontal line represents bath perfusion with 500 μM Al in the bath solution. (B) KAT1 current recorded from the same oocyte under the same protocol as in (A). The arrow indicates delivery of 23 nL of 50 mM AlCl3 into the oocyte cytosol. Time/current scales are shown for both (A) and (B).
Figure 5.
Figure 5.
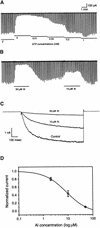
Al Effect on KAT1 Currents in Giant Patch Recording. (A) ATP regulation of KAT1 activity. Macroscopic KAT1 currents were recorded in the presence of various concentrations of ATP in a giant oocyte membrane inside-out patch. The voltage protocol is similar to that in Figure 4, except that a positive voltage ramp to 20 mV was added after each testing ramp to monitor the leak current. Time/current scales are noted for both (A) and (B). (B) Al inhibition of KAT1 activity. KAT1 current was recorded in the presence of 10 and 50 μM Al and 2 mM ATP in the solution perfusing the cytoplasmic side of the membrane. (C) KAT1 currents elicited by a stepping voltage pulse from 0 to −160 mV in the presence of 0 (control), 10, and 50 μM Al. (D) Concentration-dependent Al inhibition of KAT1 activity in giant patch recording. Currents are normalized as the percentage of the current before Al application. Al concentrations are presented in logphase. The smooth trace is the best fit of the data with the power logistic function I/I0 = 1/{1 + (C/C50)p}, where I denotes the KAT1 current amplitudes at different concentrations of Al, I0 is the I in the absence of Al, C denotes the concentrationof Al applied, C50 is the C resulting in 50% of inhibition, and p reflects the slope of the IC curve. In this fit, C50 is 6.8 μM and p is 1.14. Error bars indicate ±se.
Figure 6.
Figure 6.
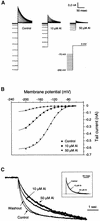
Al Modification of KAT1 Activation Kinetics. (A) KAT1 tail currents (It) from a giant inside-out patch of oocyte plasma membrane in the presence of 0 (control), 10, and 50 μM Al in the bath solution (cytoplasmic side). The tail currents were elicited by a two-step voltage protocol described at bottom right. The first 6-sec prepulse to voltages between −70 and −200 mV (shown partially) was applied and jumped to the second pulse at 0 mV. To induce clear tail currents in this condition, external (pipette) K+ concentration was reduced to 5 mM (see Methods). (B) ItV curves of KAT1 tail currents from the data in (A). Data are fitted with a Boltzmann function of the form It(V) = I0 /{1 + exp[(VV1/2) · zF/RT]}, where I0 represents the current amplitude at the maximal open probability. The other abbreviations are described in Results. The fitting parameters are as follows: control: I0, −0.62 nA; V1/2, −136.18 mV; z, 1.43 e; 10 μM Al: I0, −0.37 nA; V1/2, −172.22 mV; z, 1.41 e; 50 μM Al: I0, −0.095 nA; V1/2, −187.08 mV; z, 1.40 e. e stands for electronic charge. (C) Activation time course of KAT1 in the presence of 0 (control), 10, and 50 μM Al and after removal of Al (washout). KAT1 currents were induced by the voltage pulse at −160 mV for 6 sec, and the traces were scaled to the same amplitude at the end of the test pulse. The inset shows a comparison of the deactivation time course from tail currents at the −180-mV prepulse shown in (A). The currents are normalized to the same amplitude at the beginning of the tail currents. The dotted line indicates the current basal level.
Figure 7.
Figure 7.
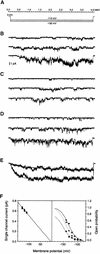
Al Effect on Single-Channel Current of KAT1 in Oocyte Membranes. (A) The time scale and voltage protocol used for single-channel recording. Three different voltage pulses (−110, −120, and −130 mV) were used as test potentials, and the holding potential was held at 0 mV. (B) Single-channel current traces recorded from KAT1-expressing oocytes under the control conditions. The scale bar is applicable for (B) to (D). (C) Single-channel current traces recorded from the same patch as in (B) in the presence of 10 μM Al in the bath. (D) Single-channel current traces recorded from the same patch as in (B) and (C) after removal of Al from the bath solution. (E) Matching single-channel currents with giant patch currents. The noisy traces represent ensemble averages of single-channel currents from 30 individual traces at −140 mV before (bottom) and after (top) application of 10 μM Al. The smooth traces were derived from giant patch recordings at −140 mV with (bottom) or without (top) 10 μM Al. The two traces from different recording configurations are scaled to the same amplitude at the end of test pulses to compare their time courses. (F) Single-channel current amplitude and open probability plotted against membrane potentials. The data are collected from (B) (control; closed circle), (C) (10 μM Al; closed square), and (D) (washout; closed triangle). The open probabilities are fitted with the Boltzmann function PO = POmax/{1 + exp[(VV1/2) · zF/RT]}. The symbols are described in Results. The Pomax for control is valued at 1. The fitting parameters are as follows: control: Pomax, 1; V1/2, −132 mV; z, 1.8 e; 10 μM Al: Pomax, 0.8; V1/2, −152 mV; z, 1.8 e; washout: Pomax, 0.98; V1/2, −140 mV; z, 1.9 e. e stands for electronic charge.
Figure 8.
Figure 8.
Effects of Al Analogs and Ca2+ on KAT1 Currents in Oocyte Giant Patch Recording. (A) Current spikes from giant patch recording in the presence of La3+, Ca2+, or Al in the bath (cytosolic side). The scales are noted for both (A) and (B). The total concentration of each ion is indicated. (B) Giant patch current spikes in the presence of Gd3+ or Al.
Figure 9.
Figure 9.
Effects of Calcium Channel Antagonists and DNP on Al Inhibition of Kin in Guard Cells. (A) Verapamil and La3+ prevented Al inhibition of Kin in the whole-cell configuration. Verapamil, La3+, or nifedipine was added to bath solution 30 min before recording. Closed circles, control (n = 12); open circles, 50 μM verapamil (n = 14); closed squares, 100 μM La3+ (n = 6); and open squares, 50 μM nifedipine (n = 4). The horizontal line indicates perfusion with 50 μM Al in the bath solution. The current amplitude before the application of Al was treated as I0 for calculation of I/I0. (B) DNP inhibited recovery of K in after Al inhibition. Open circles indicate the effect of short-term Al exposure (dotted horizontal line); closed circles indicate the effect after long-term application (solid horizontal line); and open squares denote the effect of 50 μM DNP on the current recovery after short-term exposure (dotted horizontal line). Error bars indicate ±se.
Figure 10.
Figure 10.
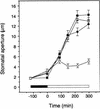
Effect of Verapamil on Al-Inhibited Stomatal Opening. Stomatal aperture was measured on epidermal peels incubated in the peel solution (closed circles), peel solution plus 2 mM Al (open circles), peel solution plus 50 μM verapamil (closed squares), and peel solution plus 2 mM Al plus 50 μM verapamil (open squares). The incubation started 2 hr before illumination. The solid bar and the open bar indicate dark and light conditions, respectively. Error bars indicate ±se.

Similar articles

Cited by

References

    1. Anderson, J.A., Huprikar, S.S., Kochian, L.V., Lucas, W.J., and Gaber, R.F. (1992). Functional expression of a probable Arabidopsis thaliana potassium channel in Saccharomyces cerevisiae. Proc. Natl. Acad. Sci. USA 89, 3736–3740. - PMC - PubMed
    1. Archambault, D.J., Zhang, G., and Taylor, G.J. (1997). Spatial variation in the kinetics of aluminium (Al) uptake in roots of wheat (Triticum aestivum L.) exhibiting differential resistance to Al: Evidence for metabolism-dependent exclusion of Al. J. Plant Physiol. 151, 668–674.
    1. Assmann, S.M. (1993). Signal transduction in guard cells. Annu. Rev. Cell Biol. 9, 345–375. - PubMed
    1. Bei, Q., and Luan, S. (1998). Functional expression and characterization of a plant K+ channel gene in a plant cell model. Plant J. 13, 857–865. - PubMed
    1. Boyer, J.S. (1985). Water transport. Annu. Rev. Plant Physiol. 36, 473–516.

Publication types

MeSH terms

LinkOut - more resources