Clinical Trial
. 2001 Jun 15;21(12):4530-41.
doi: 10.1523/JNEUROSCI.21-12-04530.2001.

Normalization models applied to orientation masking in the human infant

Affiliations
Clinical Trial

Normalization models applied to orientation masking in the human infant

T R Candy et al. J Neurosci. .

Abstract

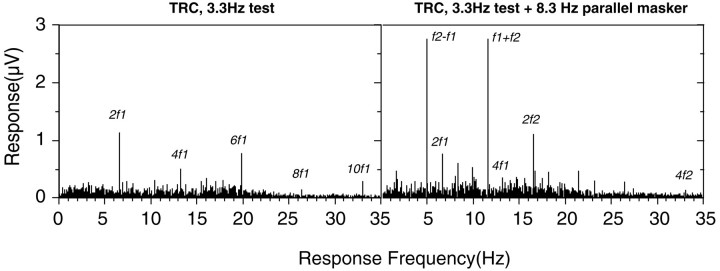
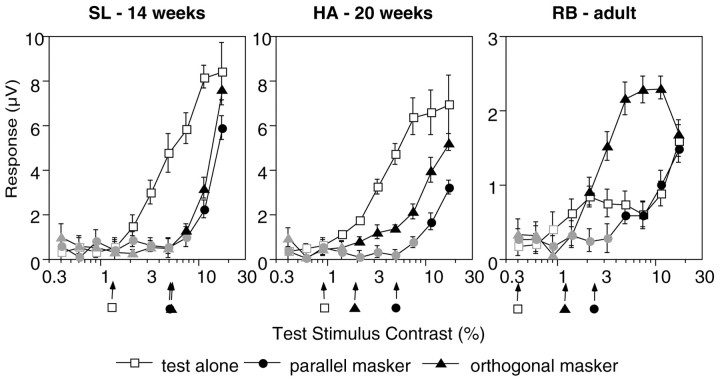
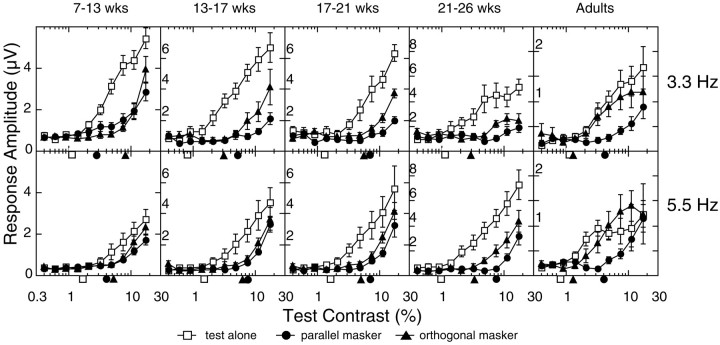
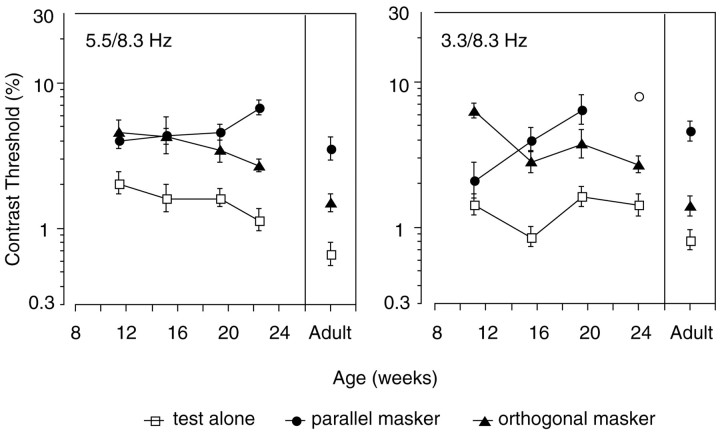
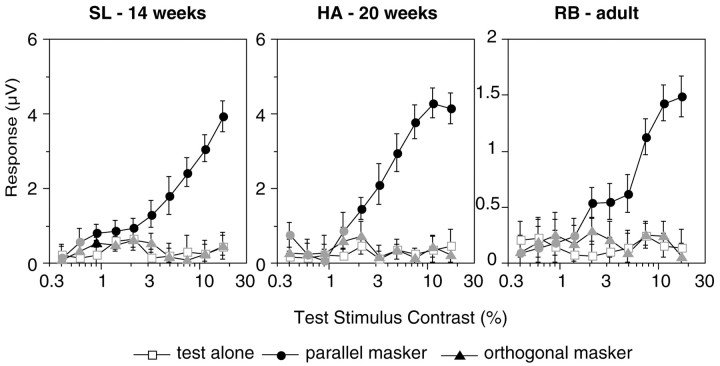
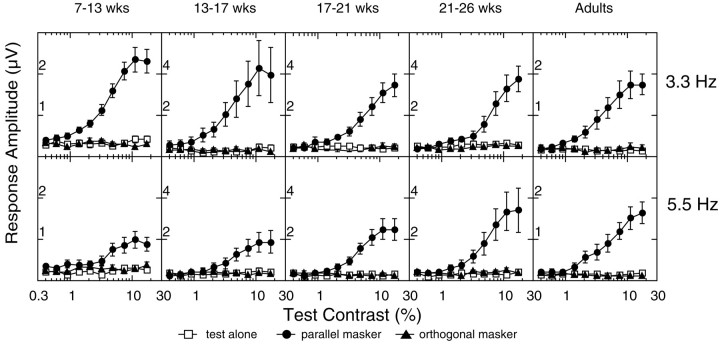
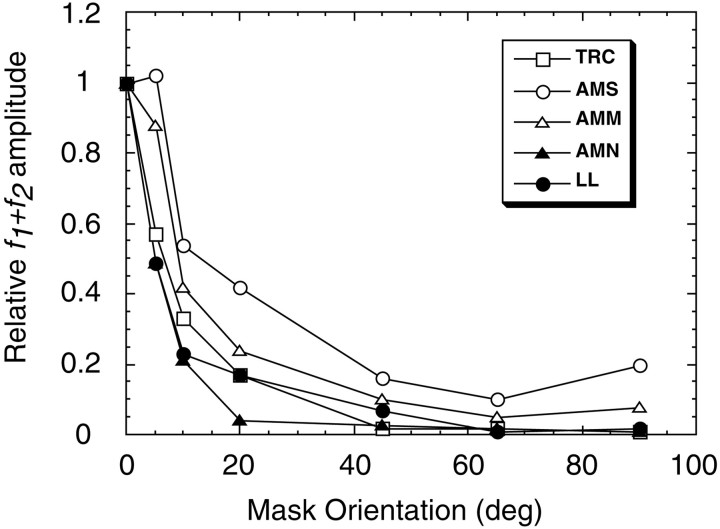
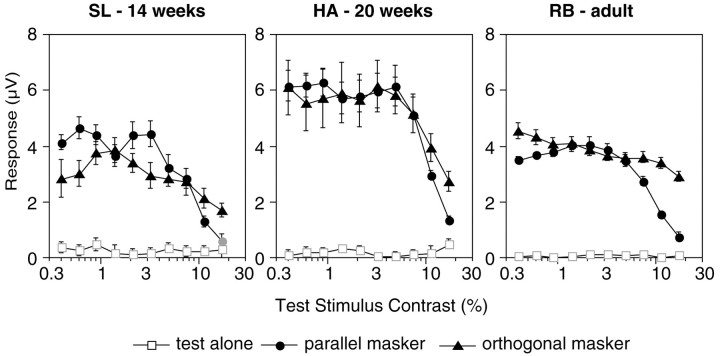
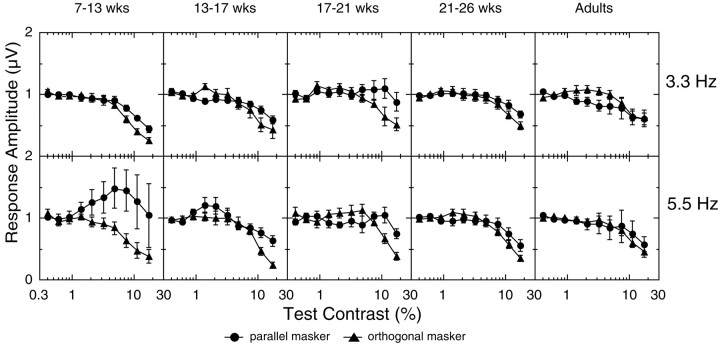
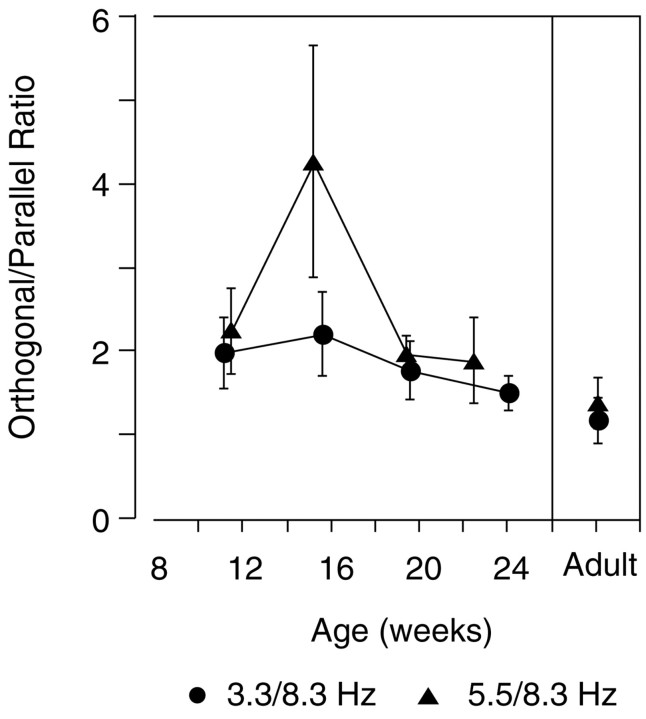
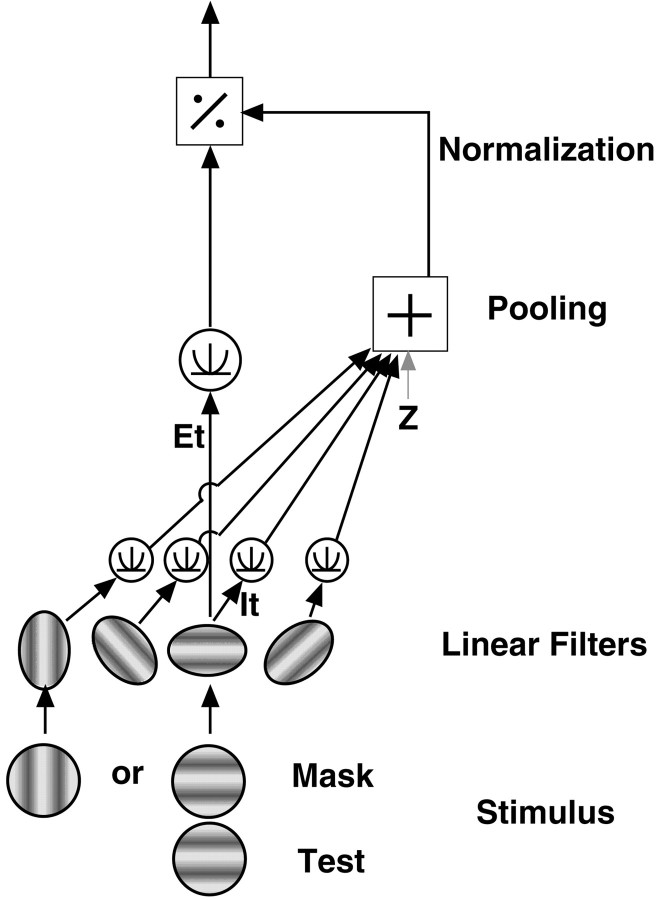
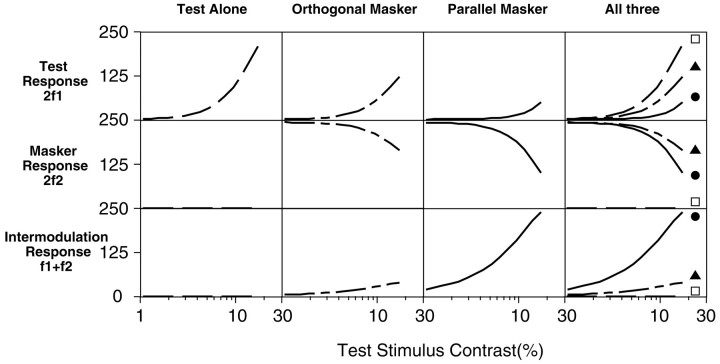
Human infants can discriminate the orientation of lines within the first week after birth (Atkinson et al., 1988; Slater et al., 1988) but have immature orientation-selective pattern masking until after 6 months of age (Morrone and Burr, 1986). Here the development of orientation processing is further examined using a visual-evoked potential paradigm and normalization models of pattern masking. Contrast response functions were measured for 1 cycle per degree (cpd) gratings, counterphase-reversed in contrast at either 3.3 or 5.5 Hz. A second 1 cpd, 20% contrast, 8.3 Hz grating of either the same or orthogonal orientation was added as a mask. Evoked responses associated with the test grating, the mask, and intermodulation between the two were individually extracted using spectral analysis of the scalp-recorded EEG. Adults exhibited orientation selectivity in the masking of their test component responses and in nonlinear intermodulation between the test and mask stimuli. Infants <5 months old, however, demonstrated nonselective masking or a reversed selectivity in their responses to the test component, with adult-like orientation selectivity in their intermodulation responses. Within the context of a normalization model of pattern masking, the results are consistent with the existence of oriented filters early in life the responses of which are normalized immaturely until approximately 5 months of age.


Figures

Fig. 1.
Fig. 1.
Example of temporal frequency spectra recorded from an adult (TRC). Left, Data recorded using a 20% contrast, 1 cpd grating, reversed in contrast at 3.3 Hz. The voltage response is plotted as a function of analysis frequency. Right, The response to a two-input stimulus composed of two 20% contrast, 1 cpd gratings, one reversed at 3.3 Hz and the other at 8.3 Hz. The two gratings were vertical and were aligned in spatial phase.
Fig. 2.
Fig. 2.
VEP contrast response functions for two individual infants (HA, SL) and an adult (RB). The voltage response at the second harmonic 2f1 of the test stimulus reversal rate is plotted as a function of contrast of the test stimulus. Open squares represent the response in the test-alone condition,filledtriangles represent the orthogonal mask condition, and filled circles represent the parallel mask condition. Mask contrast was 20%. Contrast thresholds (arrows) were estimated by extrapolating to zero from the linear portion of the contrast response function (filled symbols). Portions of the curve where the signal was not significantly different from 0 V (p < 0.05) are shown in gray[tcirc statistic (Victor and Mast, 1991)]. In the adult, the test-alone threshold was estimated from the first monotonically increasing portion of the record.
Fig. 3.
Fig. 3.
Average VEP contrast response functions at the test stimulus frequency 2f1. The amplitude functions were averaged incoherently across all observers in each of five age groups [7–13 weeks (n = 10), 13–17 weeks (n = 8), 17–21 weeks (n= 8), 21–26 weeks (n = 8), and adult (n = 8)]. Data from the 3.3 and 8.3 Hz and the 5.5 and 8.3 Hz stimulus pairs are shown in the topand bottom rows, respectively. Contrast thresholds extrapolated from these average functions are plotted for each condition on the x-axis. Open squaresrepresent the response in the test-alone condition, filled triangles represent the orthogonal mask condition, andfilled circles represent the parallel mask condition.wks, Weeks.
Fig. 4.
Fig. 4.
Contrast threshold extrapolations from the 2f1 functions of individual observers, averaged into the five age groups plotted in Figure 3 [7–13 weeks (n = 10), 13–17 weeks (n = 8), 17–21 weeks (n = 8), 21–26 weeks (n = 8), and adult (n = 8)]. The left and right panels present data from the 5.5 and 8.3 Hz and the 3.3 and 8.3 Hz temporal frequency pairs, respectively. Open squares represent the response in the test-alone condition, filled triangles represent the orthogonal mask condition, and filled circlesrepresent the parallel mask condition. Thresholds were not measurable with the parallel mask in the oldest 3.3 and 8.3 Hz infant age group (the open circle is plotted at the threshold of the one infant who provided a significant signal; see Results, Masking of the test stimulus).
Fig. 5.
Fig. 5.
Individual contrast response functions for the sum intermodulation frequency f1 +f2. Response voltage is plotted as a function of test stimulus contrast. The conventions and recordings are the same as in Figure 2. The test-alone function (open symbols) represents the experimental noise level because no mask was present.
Fig. 6.
Fig. 6.
Average VEP contrast response functions at the sum intermodulation frequency f1 +f2. The conventions and recordings are the same as in Figure 3. The test-alone function (open symbols) represents the experimental noise level because no mask was present.
Fig. 7.
Fig. 7.
Orientation tuning of the sum intermodulation response in five adults (AMM, AMN,AMS, LL, TRC). The normalized sum response is plotted as a function of mask offset. Each observer's response function was normalized to the amplitude for the parallel-masking condition (0 orientation offset). The intermodulation response has dropped to 50% of maximum at ∼10° of orientation offset.
Fig. 8.
Fig. 8.
Individual contrast response functions for the mask frequency 2f2. Voltage response is plotted as a function of the test stimulus contrast. The recordings and conventions are the same as those used in Figures 2 and 5. The test-alone function (open symbols) represents the experimental noise level because no mask was present.
Fig. 9.
Fig. 9.
Average normalized VEP contrast response functions at the second harmonic of the mask stimulus frequency 2f2. The conventions and recordings are the same as in Figures 3 and 6. Each individual's 2f2 contrast response functions for the orthogonal- and parallel-masking conditions were normalized to the mean of the first three points on the function (lowest test stimulus contrast values). Eleven 2f2 functions, in which the signal-to-noise ratio remained <3:1 throughout the condition, were excluded from this analysis.
Fig. 10.
Fig. 10.
Relative masking of the mask frequency 2f2 at the maximum test stimulus contrast (17.1%). The normalized amplitude (as in Fig. 9) at the highest test stimulus contrast in the orthogonal condition was divided by the same point for the parallel condition to form the ratios plotted here.
Fig. 11.
Fig. 11.
Schematic of the pattern-masking model of Foley for a horizontal test stimulus [Foley (1994), his model 3]. The excitatory response of the matched filters is raised to an exponent and then divided by the pooled responses of a broad range of filters (the responses of which have also been raised to an exponent). A parallel mask generates responses in the same matched filters, and therefore, the test and mask are combined in both the excitatory and divisive responses. An orthogonal mask, however, generates responses in matched filters oriented orthogonally to the test, and therefore, there is minimal contribution from the mask to the excitatory response, and the contributions to the divisive response are not combined until the pooling stage (after they have been raised to the exponent).
Fig. 12.
Fig. 12.
Predictions of Foley's pattern-masking model for combined sinusoidal inputs of two different frequencies,f1 and f2. Response magnitude is plotted as a function of contrast of the test stimulus f1. The test input was swept from 0.4 to 17.1% contrast, and the mask, when present, was fixed at 20% contrast. A DFT was conducted on the output of the model, and individual frequency responses are plotted in rows in the figure. The second harmonic of the test component 2f1 is shown in the top row, the second harmonic of the mask component 2f2 is shown in the middle row, and the intermodulation responsef1 + f2 is plotted in the bottom row. Response magnitudes are in arbitrary units, and the contrast units were scaled to match those used in the empirical VEP experiment. The first three columnsfrom the left represent different stimulus conditions: test component alone, test plus orthogonal mask, and test plus parallel mask. The fourth column plots all three conditions combined. The response in the orthogonal mask condition is the sum of responses from two models (each oriented linear filter was assigned a relative response of 0.05 to an orthogonal stimulus). One model was tuned to the test orientation (Etdominates in the numerator), and the other was tuned to the mask orientation (Em dominates in the numerator), because the VEP technique used for the empirical data collection records the combined responses of mechanisms tuned to all orientations.

References

    1. Albrecht DG, Geisler WS. Motion sensitivity and the contrast-response function of simple cells in the visual cortex. Vis Neurosci. 1991;7:531–546. - PubMed
    1. Albus K, Wolf W. Early post-natal development of neural function in the kitten's visual cortex: a laminar analysis. J Physiol (Lond) 1984;348:153–185. - PMC - PubMed
    1. Atkinson J, Hood B, Wattam-Bell J, Anker S, Tricklebank J. Development of orientation discrimination in infancy. Perception. 1988;17:587–595. - PubMed
    1. Blakemore C, Van Sluyters RC. Innate and environmental factors in the development of the kitten's visual cortex. J Physiol (Lond) 1975;248:663–716. - PMC - PubMed
    1. Blasdel G, Obermayer K, Kiorpes L. Organization of ocular dominance and orientation columns in the striate cortex of neonatal macaque monkeys. Vis Neurosci. 1995;12:589–603. - PubMed

Publication types

LinkOut - more resources