. 2001 Jun 19;98(13):7158-63.
doi: 10.1073/pnas.111163698. Epub 2001 Jun 12.

Exploring the DNA-binding specificities of zinc fingers with DNA microarrays

Affiliations

Exploring the DNA-binding specificities of zinc fingers with DNA microarrays

M L Bulyk et al. Proc Natl Acad Sci U S A. .

Abstract

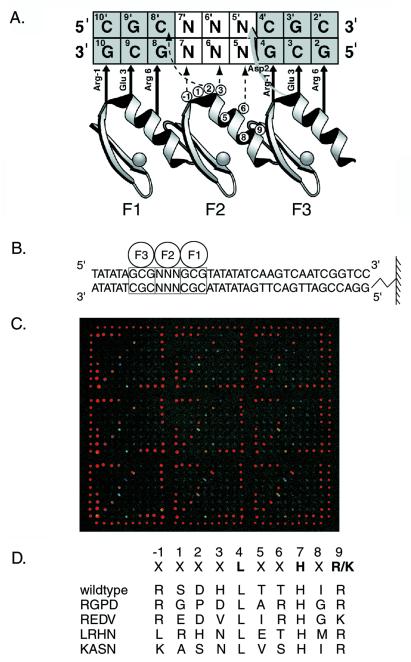
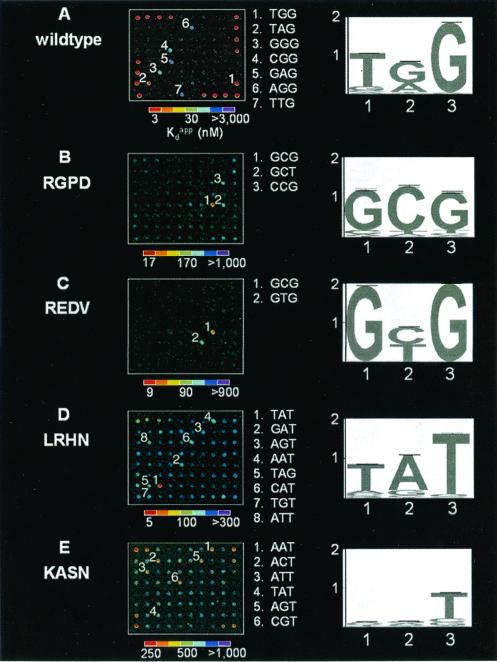
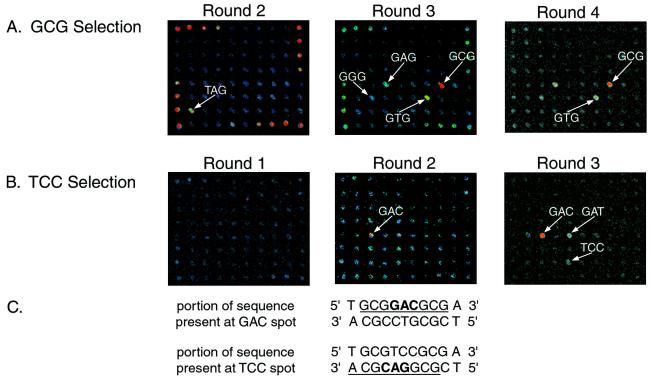
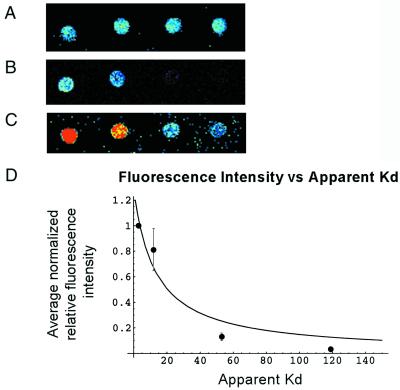
A key step in the regulation of networks that control gene expression is the sequence-specific binding of transcription factors to their DNA recognition sites. A more complete understanding of these DNA-protein interactions will permit a more comprehensive and quantitative mapping of the regulatory pathways within cells, as well as a deeper understanding of the potential functions of individual genes regulated by newly identified DNA-binding sites. Here we describe a DNA microarray-based method to characterize sequence-specific DNA recognition by zinc-finger proteins. A phage display library, prepared by randomizing critical amino acid residues in the second of three fingers of the mouse Zif268 domain, provided a rich source of zinc-finger proteins with variant DNA-binding specificities. Microarrays containing all possible 3-bp binding sites for the variable zinc fingers permitted the quantitation of the binding site preferences of the entire library, pools of zinc fingers corresponding to different rounds of selection from this library, as well as individual Zif268 variants that were isolated from the library by using specific DNA sequences. The results demonstrate the feasibility of using DNA microarrays for genome-wide identification of putative transcription factor-binding sites.


Figures

Figure 1
Figure 1
Design of microarrays for binding experiments. (A) Model depicting interactions between the Zif268 phage display library and the DNA used in phage selections. The three zinc fingers of Zif268 (F1, F2, and F3) are aligned to show contacts to the nucleotides of the DNA-binding site as inferred from the crystal structure of Zif268 and biochemical experiments. The zinc-finger amino acid positions are numbered relative to the first helical residue (position 1). The randomized positions in the α helix of the second finger are circled. DNA base pairs marked N were fixed as given sequences and used to select sequence-specific zinc-finger phage from the library. (B) Design of the DNA sequences spotted on the microarrays used in the microarray-binding experiments. F1, F2, and F3 refer to fingers 1, 2, and 3 of Zif268 variants, and the boxes indicate the three corresponding 3-bp binding sites for the three fingers. DNA base pairs marked N were systematically varied to explore the 64 different 3-bp binding sites for finger 2. The diagram shows attachment of the DNA to a glass slide via an amino linker. (C) Entire microarray, showing all nine replicates, bound by wild-type Zif268 phage. The fluorescence intensities of the spots are shown in false color, corresponding to the DNA-binding affinities of the protein for the different DNA sequences. The Cy3-labeled alignment oligonucleotide was spotted above and below each column, as well as to the right and left of each row, along the perimeter of the nine replicates. In addition, four spots of DNA containing the wild-type Zif268-binding site were spotted at higher concentrations in each of the four corners (row 1, columns 1–4; rows 1–4, column 10; row 8, columns 7–10; rows 5–8, column 1) of each replicate, as a positive control for wild-type phage binding to the microarrays in preliminary experiments. (D) Amino acid sequences of the variant α-helical regions in finger 2 of the Zif268 variants used in this study. The randomized positions are marked with an X. The three primary recognition positions are highlighted. The names of the clones are listed to the Left of these sequences. The first variant listed is wild-type Zif268.
Figure 2
Figure 2
Wild-type and variant Zif268 zinc-finger phage bound to microarrays. One of nine replicates on each microarray slide is shown for each of the binding experiments described. Spots with high relative signal intensities for each of the Zif268 variants labeled in descending numerical order according to decreasing Kformula image values, and the sequences corresponding to each of these numbered spots are listed between the microarray images and the sequence logos. The fluorescence intensities of the spots are shown in false color, corresponding to the DNA-binding affinities. The color bars were calibrated from the Kformula images, as determined by using ELISA. Sequence logos depicting the DNA-binding site preferences of the variant zinc fingers are shown to the Right of the microarrays. The numbers along the base of the sequence logo indicate the 5′, middle, and 3′ nucleotides of the 3-bp DNA-binding site for finger 2. The values along the y axis indicate the number of bits of information at each position of the 3-bp DNA-binding site. The height of each nucleotide at each position of the 3-bp DNA-binding site is determined by multiplying the relative DNA-binding affinity of the nucleotide by the total information at that position, so that a taller printed nucleotide is more beneficial for tight binding than a shorter one. The nucleotides are sorted so that the nucleotide most beneficial for tight binding is on top. (A) Wild type; (B) RGPD; (C) REDV; (D) LRHN; (E) KASN. Single-letter abbreviations for the amino acid residues are as follows: A, Ala; D, Asp; E, Glu; G, Gly; H, His; I, Ile; K, Lys; L, Leu; M, Met; N, Asn; P, Pro; R, Arg; S, Ser; T, Thr; V, Val.
Figure 3
Figure 3
Evolution of sequence-specific DNA-binding zinc fingers from selections of the phage display library. Phage pools isolated from different rounds of selections analyzed by using DNA microarrays. One of nine replicates on each microarray slide is shown for each of the binding experiments described. Spots with high relative signal intensities in each of the rounds are labeled to indicate the bound DNA sequence. (A) Rounds 2–4 of the selection by using the middle triplet GCG. Round 1 (not shown) did not have any outstanding spots. Round 2 shows binding to the wild-type Zif268 DNA-binding site, which is spotted at a high concentration on the periphery of the array (see supplemental data). (B) Rounds 1–3 of the selection using the middle triplet TCC. Round 1 did not have any outstanding spots. (C) Portions of the sequences present at the GAC and TCC spots on the microarrays. The 9-bp binding sites for variant zinc-finger phage are underlined, and the 3-bp binding sites for finger 2 are boldfaced.
Figure 4
Figure 4
Relationship between relative fluorescence intensity and DNA-binding affinity. (A) SybrGreen I-stained microarray; (B) low laser-power scan of wild-type Zif268 bound to a microarray; (C) high laser-power scan of wild-type Zif268 bound to a microarray. Red pixels indicate saturated signal intensity. (D) Plot showing the relationship between relative signal intensity and Kformula image. Error bars indicate 1 SD of the SybrGreen I normalized binding data. These sequences were chosen because they span a range of relative fluorescence intensities. For this evaluation, a separate set of microarrays was spotted with these DNA sequences. Because some of these sequences contain mutations in the binding sites for fingers 1 and 3 of Zif268, they were not printed on the microarrays containing all different 3-bp binding sites for finger 2.
Figure 5
Figure 5
Binding of the entire zinc-finger phage display library to a microarray indicates that DNA triplets with a 5′ T or G are bound preferentially over triplets with a 5′ A or C. The data are plotted to analyze binding as a function of the 5′ nucleotide. The average relative fluorescence intensity of all 64 different triplet-binding sites was normalized to 1; therefore, a value less than 1 indicates the particular sequence is bound less than average, and a value greater than 1 indicates the particular sequence is bound greater than average.
Figure 6
Figure 6
Specific binding of S. cerevisiae transcription factors Rpn4 and Zap1 to microarrays. The image on the Left is a portion of a microarray bound by Rpn4; the image on the Right is a portion of a microarray bound by Zap1. The large white spots along three sides of the microarray images are alignment spots that indicate the positions of each row and column. The first two columns of experimental spots, indicated by “+” and “−” and labeled “Zap1,” correspond to those spots containing 37-bp long positive and 39-bp long negative control sequences for binding by Zap1. The next two columns of experimental spots, indicated by “+” and “−” and labeled “Rpn4,” correspond to those spots containing positive and negative control sequences (both 33 bp long) for binding by Rpn4.

References

    1. Elrod-Erickson M, Pabo C. J Biol Chem. 1999;274:19281–19285. - PubMed
    1. Desjarlais J R, Berg J M. Proteins. 1992;12:101–104. - PubMed
    1. Desjarlais J R, Berg J M. Proc Natl Acad Sci USA. 1992;89:7345–7349. - PMC - PubMed
    1. Choo Y, Klug A. Proc Natl Acad Sci USA. 1994;91:11168–11172. - PMC - PubMed
    1. Choo Y, Klug A. Proc Natl Acad Sci USA. 1994;91:11163–11167. - PMC - PubMed

Publication types

LinkOut - more resources