

Are rare variants responsible for susceptibility to complex diseases?
- PMID: 11404818
- PMCID: PMC1226027
- DOI: 10.1086/321272
Are rare variants responsible for susceptibility to complex diseases?
Abstract
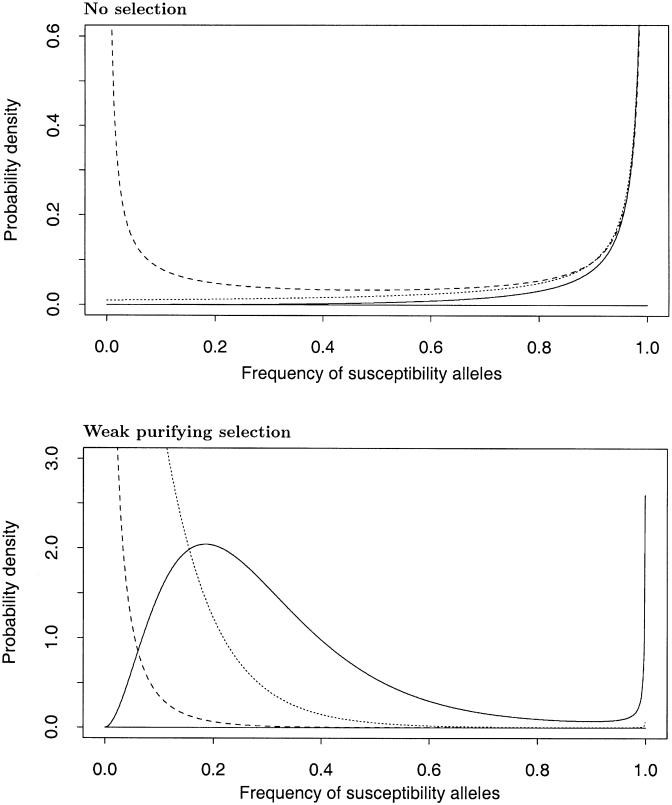
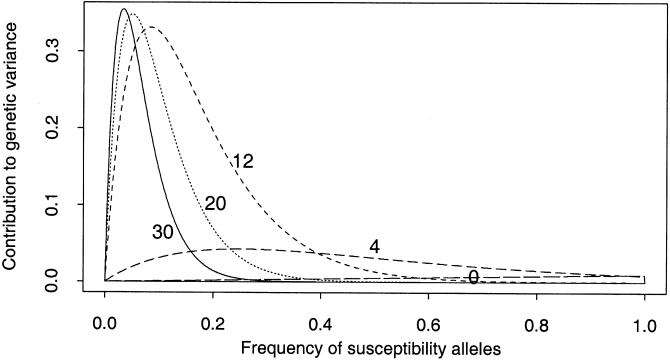
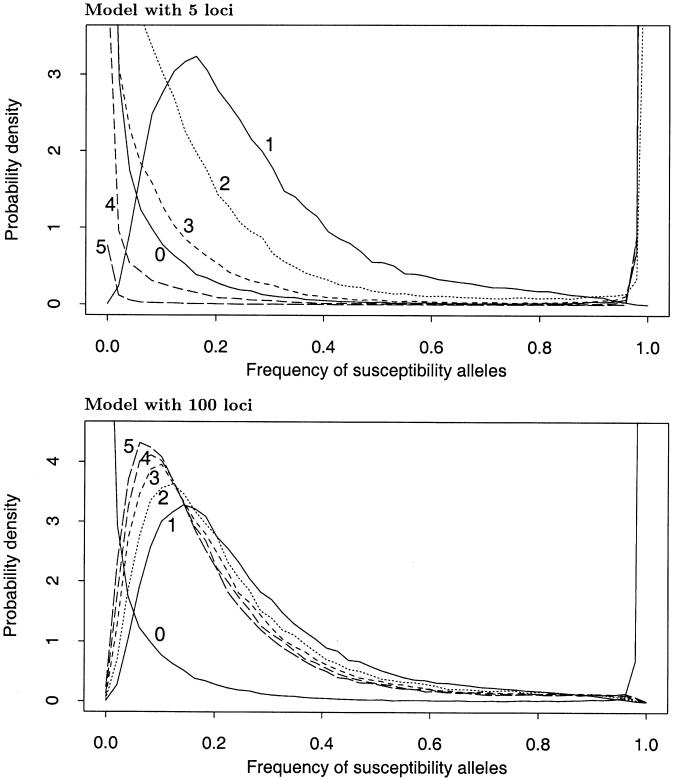
Little is known about the nature of genetic variation underlying complex diseases in humans. One popular view proposes that mapping efforts should focus on identification of susceptibility mutations that are relatively old and at high frequency. It is generally assumed-at least for modeling purposes-that selection against complex disease mutations is so weak that it can be ignored. In this article, I propose an explicit model for the evolution of complex disease loci, incorporating mutation, random genetic drift, and the possibility of purifying selection against susceptibility mutations. I show that, for the most plausible range of mutation rates, neutral susceptibility alleles are unlikely to be at intermediate frequencies and contribute little to the overall genetic variance for the disease. Instead, it seems likely that the bulk of genetic variance underlying diseases is due to loci where susceptibility mutations are mildly deleterious and where there is a high overall mutation rate to the susceptible class. At such loci, the total frequency of susceptibility mutations may be quite high, but there is likely to be extensive allelic heterogeneity at many of these loci. I discuss some practical implications of these results for gene mapping efforts.
Figures
References
Electronic-Database Information
-
- Author's Web site, http://www.stats.ox.ac.uk/~pritch/home.html (for programs used)
References
-
- Cargill M, Altshuler D, Ireland J, Sklar P, Ardlie K, Patil N, Shaw N, Lane CR, Lim EP, Kalyanaraman N, Nemesh J, Ziaugra L, Friedland L, Rolfe A, Warrington J, Lipshutz R, Daley GQ, Lander ES (1999) Characterization of single-nucleotide polymorphisms in coding regions of human genes. Nat Genet 22:231–238 - PubMed
-
- Chakravarti A (1999) Population genetics—making sense out of sequence. Nat Genet 21:56–60 - PubMed
-
- Chao L (1990) Fitness of RNA virus decreased by Muller’s ratchet. Nature 348:454–455 - PubMed
-
- Ewens WJ (1979) Mathematical population genetics. Springer-Verlag, New York
-
- Eyre-Walker A, Keightley PD (1999) High genomic deleterious mutation rates in hominids. Nature 397:344–347 - PubMed
Publication types
MeSH terms
LinkOut - more resources
Full Text Sources
Other Literature Sources
Medical
