. 2001 Jun 15;20(12):3156-66.
doi: 10.1093/emboj/20.12.3156.

The distal region and receptor tyrosines of the Epo receptor are non-essential for in vivo erythropoiesis

Affiliations

The distal region and receptor tyrosines of the Epo receptor are non-essential for in vivo erythropoiesis

H Zang et al. EMBO J. .

Abstract

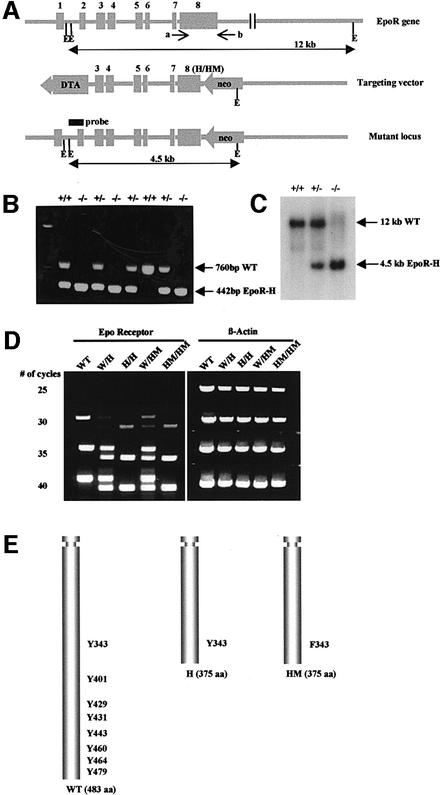
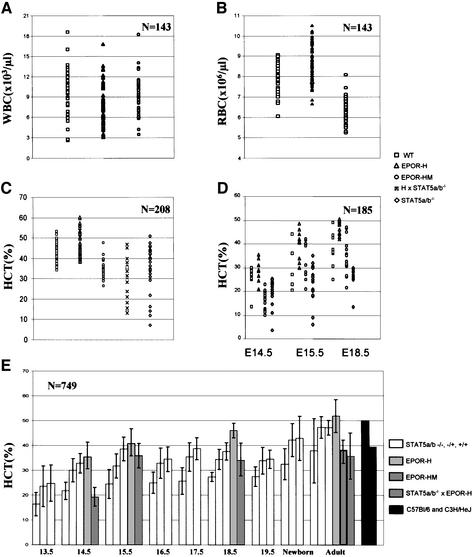
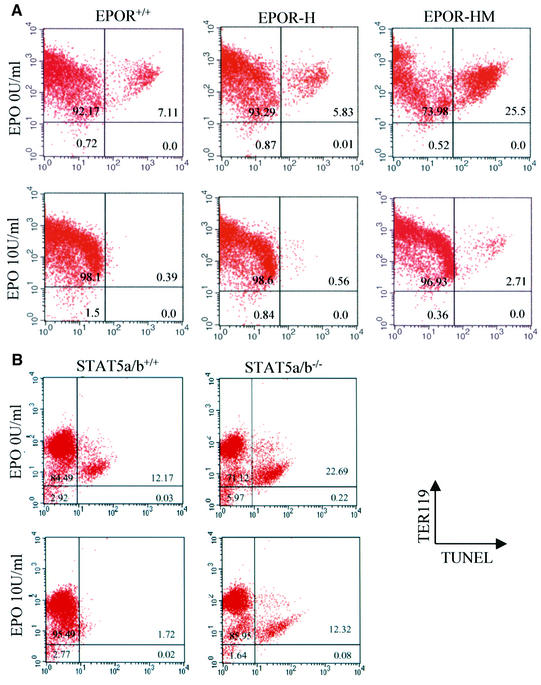
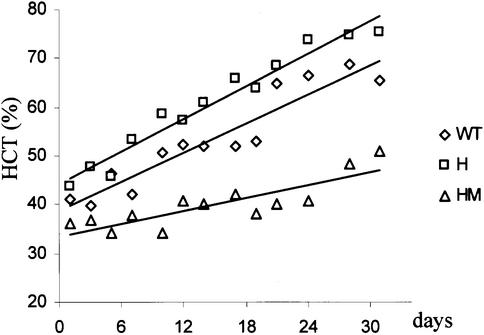
The erythropoietin receptor (EpoR) is required for the proliferation and survival of committed erythroid lineage cells. Previous studies have utilized receptor mutations to show the requirement for the distal half of the cytoplasmic domain of the EpoR and receptor tyrosines for activation of signaling pathways potentially critical to Epo function. To extend these studies to in vivo erythropoiesis, we have created two mutant strains of mice. One strain (H) contains a truncation of the distal half of the cytoplasmic domain, while the second strain (HM) contains the same truncation as well as the mutation of the residual tyrosine (Y(343)) to a phenylalanine. Strikingly, both strains of mice are viable, with only slight alterations in constitutive erythropoiesis or in in vitro assays of red cell lineage function. Challenging H mutant mice with continuous injections of Epo results in an erythrocytosis that is not seen in HM mice. The results demonstrate that neither the distal region nor receptor tyrosines are essential for in vivo EpoR function, but contribute to receptor function in a subtle manner.


Figures

None
Fig. 1. Generation of EpoR-H and EpoR-HM mice. (A) Targeting strategy. Solid boxes with numbers 1–8 indicate exons of the EpoR gene. Arrows labeled a and b indicate PCR primers used for geno typing. E, EcoRI. (H/HM) indicates H and HM mutation of exon 8. The H mutation was produced by truncation of the C-terminal 108 amino acids. The HM mutation was produced by the same truncation and a mutation of Y343 to F343 on exon 8. Homologous recombination replaced exon 8 with the H or HM mutant DNA, resulting in a truncated receptor with only one tyrosine residue on its cytoplasmic domain (EpoR-H) or a truncated receptor with Phe substitution for residue Y343 (EpoR-HM). (B) PCR analysis of tail clippings from wild-type and mutant mice: +/+, wild type; +/–, heterozygous for wild type and H allele; –/–, homozygous for H allele. Genomic DNA from tail clippings was used for PCR with primers a and b. The same PCR analysis was used to identify EpoR-HM mice (data not shown). (C) Southern blot analysis of DNA from offspring derived from heterozygous matings of wild-type and H mice. Genomic DNA was digested with EcoRI and probed with the 0.8 kb genomic DNA fragment indicated in (A). (D) Semi-quantitative RT–PCR analysis of EpoR, EpoR-H and EpoR-HM mRNA in adult bone marrow cells. The PCR products are 667 bp for EpoR wild-type allele, 349 bp for EpoR-H or EpoR-HM mutant allele and 900 bp for β-actin. The numbers indicate the number of PCR cycles performed. (E) Schematic diagram of wild-type, H and HM EpoR. The relative positions of tyrosine residues are marked.
None
Fig. 2. Effect of EpoR-H or EpoR-HM on the activation of Stat5a/b in bone marrow cells. Bone marrow cells from femurs of adult (≥4 weeks) mice were isolated and suspended in α-MEM medium. After 4 h of growth arrest, cells were stimulated with either 10 ng/ml recombinant mIL-3 or 50 U/ml recombinant hEpo for 30 min or 3 h. Whole-cell extracts were prepared and analyzed by EMSA. γ-32P-labeled DNA from the Stat5a/b binding site in the β-casein promoter was used as binding sequence for the assay.
None
Fig. 3. Morphology of EpoR-H and EpoR-HM embryos. Representative photographs of embryos at E12.5 from wild type (A), EpoR-H (B) and EpoR-HM (C). Photographs of Jak2–/– (D), EpoR–/– (E) and Stat5a/b–/– (F) at E12.5 are shown for comparison.
None
Fig. 4. In vitro colony formation of hematopoietic progenitors from wild-type, EpoR-H, EpoR-HM and Stat5a/b–/– mice in response to various cytokines. The numbers of colonies/105 cells formed from E12.5 fetal liver cell cultures (A) or from bone marrow cell cultures (B) are plotted. The mean and standard deviation are shown from six independent assays. The two-tailed P values for comparison of the various mutant strains with wild-type mice or embryos are >0.01, with the exception of the BFU-E colonies for bone marrow from HM mice (P = 0.004) and of CFU-E colonies for fetal liver cells from H mice (P = 0.00006). Cells from E12.5 embryos or femurs of adult mice were prepared in α-MEM medium containing 2% FBS and counted in the presence of 3% acetic acid to lyse erythrocytes. Diluted cell suspensions and cytokines were mixed with Methocult 3230 to a final concentration of 0.9% methylcellulose. For CFU-E assay, cells were cultured in 0.2 U/ml recombinant hEpo. For BFU-E assay, cells were cultured in 3 U/ml recombinant hEpo and 10 ng/ml recombinant murine IL-3. IL-3 colony assays were performed in the presence of 10 ng/ml recombinant mIL-3. The plating conditions, cell concentration for each assay, culture conditions and colony scoring methods were exactly as described previously (Parganas et al., 1998; Teglund et al., 1998).
None
Fig. 5. Hematocrits and blood cell counts of embryos or adult mice with the indicated genotypes. For adult mice (≥4 weeks old), white blood cell numbers (A), red blood cell numbers (B) and hematocrits (C and E) were machine scored by a Hemavet 3700R counter. For embryos (D and E), blood samples were acquired using 2 µl glass micropipettes and then briefly centrifuged to measure hematocrits. N, total number of mice used for the experiment. H × Stat5a/b–/– indicates mice cross-breeding from Stat5a/b null mice with EpoR-H mice. (E) Numbers indicate days of gestation. The P values for all the comparisons support statistically significant differences in the hematocrits. To indicate the types of P values associated with the results, in (C) the two-tailed P values for the means of the various mutants relative to wild type are: H, 1.3 × 10⁻³; HM, 8.0 × 10⁻¹²; Stat5a/b, 6.4 × 10⁻⁴; H/Stat5a/b, 9.2 × 10⁻⁷.
None
Fig. 6. FACS analysis of fetal liver cells at E13.5 with combined TUNEL–Ter119 staining. Numbers in plots indicate the percentage of sorted cell population in each quadrant. The upper right quadrant in each plot represents Ter119-positive erythrocytes with TUNEL-positive apoptotic cells. (A) Fetal liver cells from EpoR wild-type, EpoR-H or EpoR-HM embryos were isolated at E13.5 and cultured in α-MEM with 2% FBS for 18 h in the presence or absence of 10 U/ml recombinant hEpo. Cells were then fixed with formalin and double stained with TUNEL reagent and Ter119 antibody. The cell suspension was analyzed by FACScan. (B) Fetal livers from Stat5a/b wild-type embryos or Stat5a/b null embryos were used for TUNEL– Ter119 double staining. Note that the EpoR mutants were performed independently of the Stat5a/b mutant studies and, consequently, should not be compared across the two experiments, but rather the mutants should be compared with their respective wild-type controls.
None
Fig. 7. Response of the EpoR mutant mice to continual injections of Epo. Mice were injected three times during a week, as described in Materials and methods, with recombinant hEpo. To prevent anomalous results from frequent bleeding, the mice were separated into groups, which were bled only every 14 days. The average hematocrits for two mice are indicated by the individual symbols. The deviations among the samples for each symbol were between 2 and 5%; consequently, error bars are not included. The line presents the linear regression of the data points for each of the mutant strains.

References

    1. Adachi M., Suematsu,S., Kondo,T., Ogasawara,J., Tanaka,T., Yoshida,N. and Nagata,S. (1995) Targeted mutation in the Fas gene causes hyperplasia in peripheral lymphoid organs and liver. Nature Genet., 11, 294–300. - PubMed
    1. Arcasoy M.O., Degar,B.A., Harris,K.W. and Forget,B.G. (1997) Familial erythrocytosis associated with a short deletion in the erythropoietin receptor gene. Blood, 89, 4628–4635. - PubMed
    1. Bergelson S., Klingmuller,U., Socolovsky,M., Hsiao,J.G. and Lodish,H.F. (1998) Tyrosine residues within the intracellular domain of the erythropoietin receptor mediate activation of AP-1 transcription factors. J. Biol. Chem., 273, 2396–2401. - PubMed
    1. Chin H., Arai,A., Wakao,H., Kamiyama,R., Miyasaka,N. and Miura,O. (1998) Lyn physically associates with the erythropoietin receptor and may play a role in activation of the Stat5 pathway. Blood, 91, 3734–3745. - PubMed
    1. Damen J.E., Wakao,H., Miyajima,A., Krosl,J., Humphries,R.K., Cutler,R.L. and Krystal,G. (1995a) Tyrosine 343 in the erythropoietin receptor positively regulates erythropoietin-induced cell proliferation and Stat5 activation. EMBO J., 14, 5557–5568. - PMC - PubMed

Publication types