. 2001 Jun 15;20(12):3177-86.
doi: 10.1093/emboj/20.12.3177.

Transcript analysis of 1003 novel yeast genes using high-throughput northern hybridizations

Affiliations

Transcript analysis of 1003 novel yeast genes using high-throughput northern hybridizations

A J Brown et al. EMBO J. .

Abstract

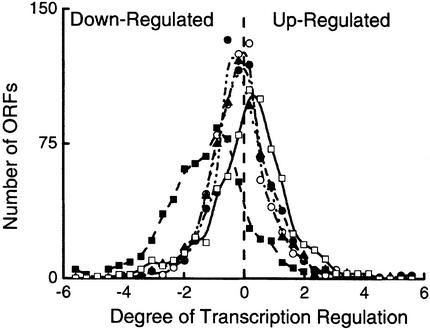
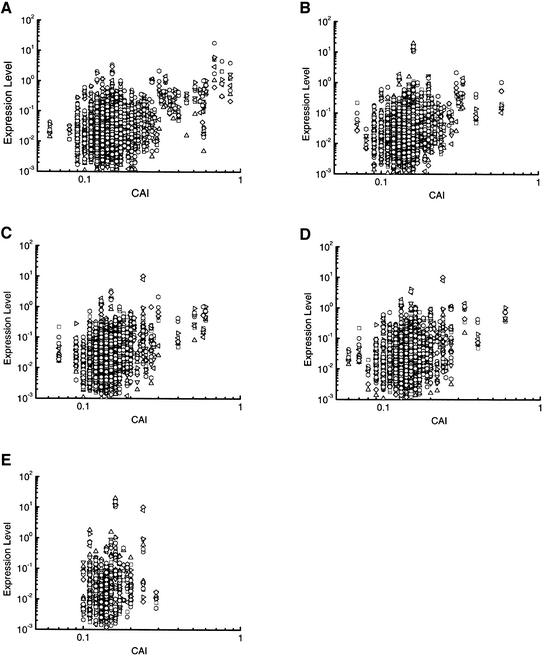
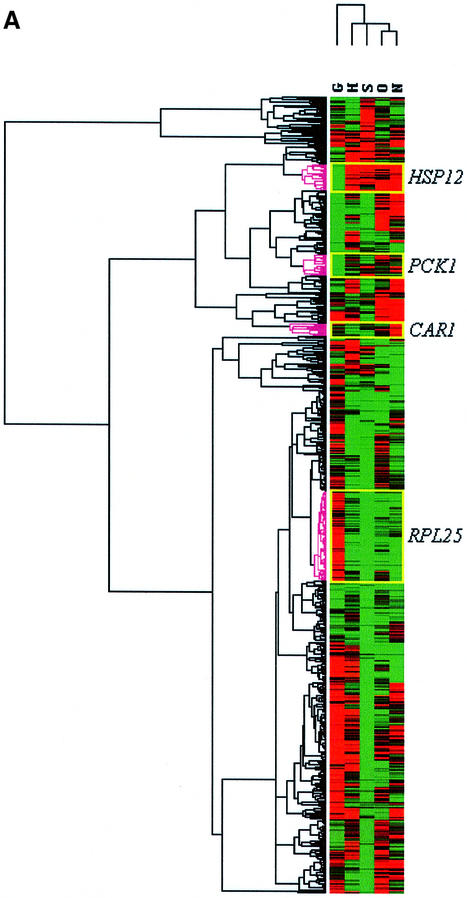
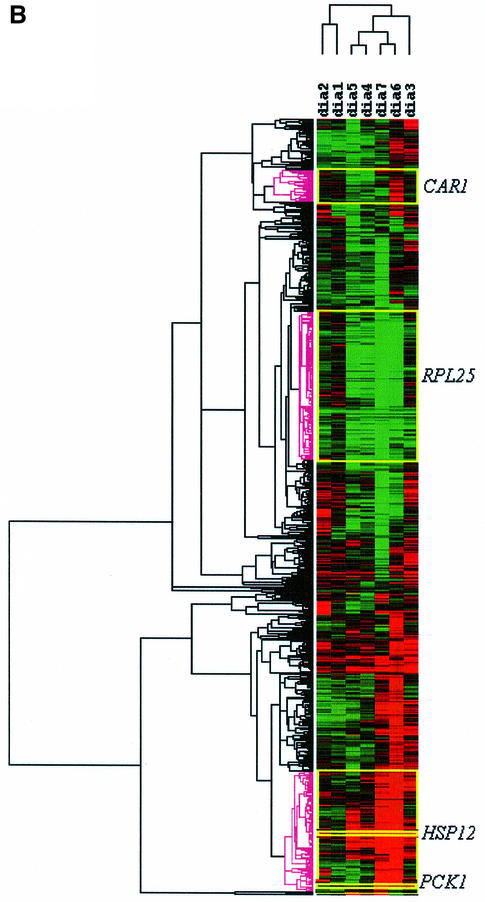
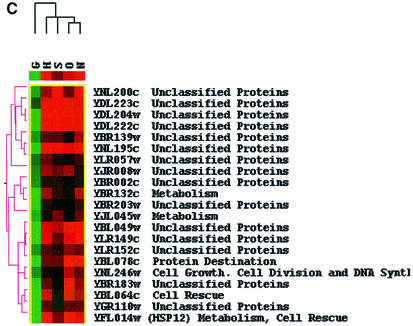
The expression of 1008 open reading frames (ORFs) from the yeast Saccharomyces cerevisiae has been examined under eight different physiological conditions, using classical northern analysis. These northern data have been compared with publicly available data from a microarray analysis of the diauxic transition in S.cerevisiae. The results demonstrate the importance of comparing biologically equivalent situations and of the standardization of data normalization procedures. We have also used our northern data to identify co-regulated gene clusters and define the putative target sites of transcriptional activators responsible for their control. Clusters containing genes of known function identify target sites of known activators. In contrast, clusters comprised solely of genes of unknown function usually define novel putative target sites. Finally, we have examined possible global controls on gene expression. It was discovered that ORFs that are highly expressed following a nutritional upshift tend to employ favoured codons, whereas those overexpressed in starvation conditions do not. These results are interpreted in terms of a model in which competition between mRNA molecules for translational capacity selects for codons translated by abundant tRNAs.


Figures

None
Fig. 1. The degree of transcription regulation in S.cerevisiae following various physiological perturbations. The degree of transcription regulation in S.cerevisiae is expressed as a frequency diagram of the number of ORFs plotted against the observed degree of regulation. The degree of regulation was calculated for each ORF for each physiological transient as detailed in Materials and methods. Down-regulated and up-regulated ORFs have negative and positive degrees of regulation, respectively. ORFs were counted in 32 uniform bins. The curves represent ORFs regulated in response to glucose upshift (open squares), heat shock (closed circles), stationary phase (closed squares), hyperosmolarity (open circles) and ammonium starvation (closed triangles).
None
Fig. 2. Correlation of transcript expression level with the codon adaptive index (CAI) for up-regulated S.cerevisiae ORFs. The transcript levels for each ORF that was up-regulated following the physiological perturbations: (A) glucose up-shift (413 ORFs); (B) heat shock (319 ORFs); (C) stationary phase (99 ORFs); (D) hyper osmolarity (283 ORFs); and (E) ammonium starvation (284 ORFs) are plotted against the CAI for the ORF. Data points are the transcript levels for ORFs detected in the eight physiological conditions examined, YPGE (squares), glucose up-shift (circles), stationary phase (triangles), YNB-glucose 30°C (inverted triangles), ammonium starvation (wide diamonds), hyperosmolarity (right-facing triangles), YNB-glucose 23°C (left-facing triangles) and heat shock (narrow diamonds).
None
Fig. 3. Cluster analysis of expression profiles for 635 ORFs in S.cerevisiae expressed following various physiological transients. (A) Cluster analysis of northern data. (B) Cluster analysis of the DeRisi et al. (1997) data subset. (C) Exploded cluster of HSP12 co-regulated ORFs from northern data. ORFs are represented as rows, and physiological conditions as columns in the matrix. Red, black and green elements in the matrix indicate up-regulated, no change and down-regulated ORFs, respectively. Cluster analysis was performed on expression profiles of 635 ORFs across the five physiological transients, glucose upshift (G), heat shock (H), stationary phase (S), hyperosmolarity (O) and ammonium starvation (N). The horizontal and vertical dendrograms indicate the degree of similarity between expression profiles for ORFs and physiological transients, respectively. The yellow boxes show areas of the matrix that correspond to clusters of ORFs closely related to and including the control ORFs, HSP12, CAR1, RPL25 and PCK1.

References

    1. Brown A.J.P. (1995) Preparation of total RNA. In Evans,I. (ed.), Methods in Yeast Molecular Biology. Humana Press, Totowa, NJ, pp. 269–267.
    1. Brown M.P.S., Grundy,W.N., Lin,D., Cristianini,N., Sugnet,C.W., Furey,T.S., Ares,M. and Haussler,D. (2000) Knowledge-based analysis of microarray gene expression data by using support vector machines. Proc. Natl Acad. Sci. USA, 97, 262–267. - PMC - PubMed
    1. Bussey H. et al. (1995) The nucleotide-sequence of chromosome I from Saccharomyces cerevisiae. Proc. Natl Acad. Sci. USA, 92, 3809–3813. - PMC - PubMed
    1. Cho R.J. et al. (1998) A genome-wide transcriptional analysis of the mitotic cell cycle. Mol. Cell, 2, 65–73. - PubMed
    1. Chu S. (1998) The transcriptional program of sporulation in budding yeast. Science, 282, 699–705. - PubMed

Publication types