. 2001 Jun;12(6):1897-910.
doi: 10.1091/mbc.12.6.1897.

Regulation of epidermal growth factor receptor signaling by endocytosis and intracellular trafficking

Affiliations
Free PMC article

Regulation of epidermal growth factor receptor signaling by endocytosis and intracellular trafficking

P Burke et al. Mol Biol Cell. 2001 Jun.
Free PMC article

Abstract

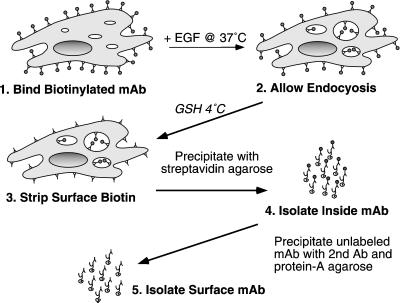
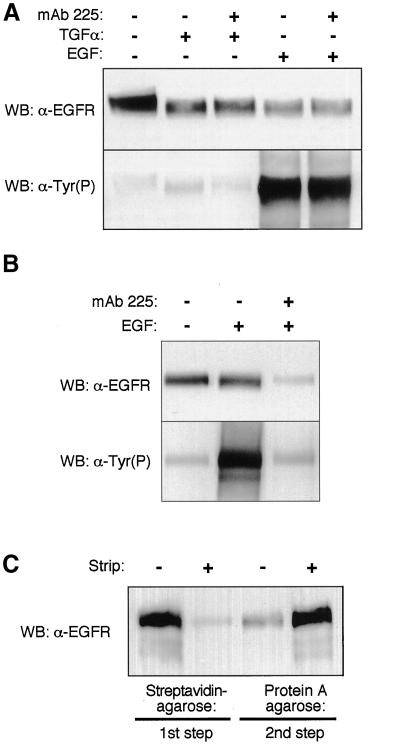
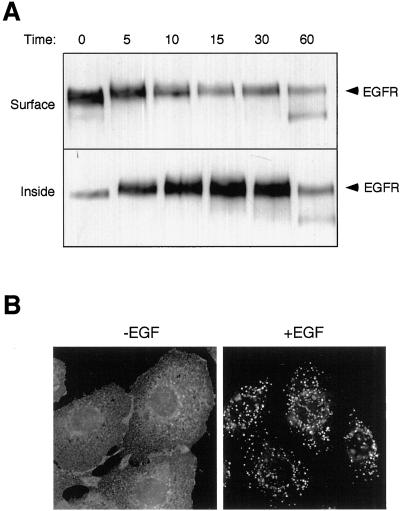
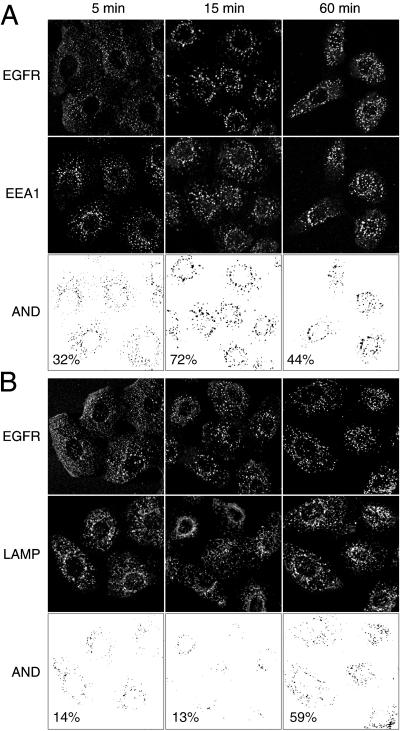
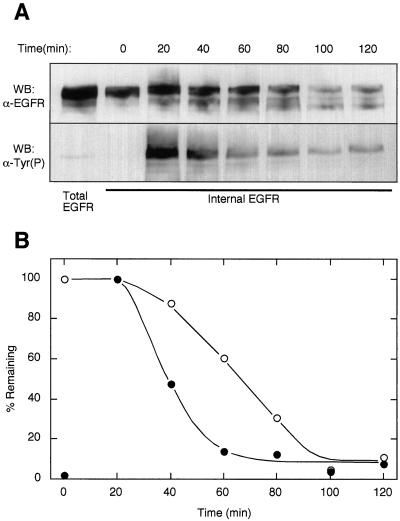
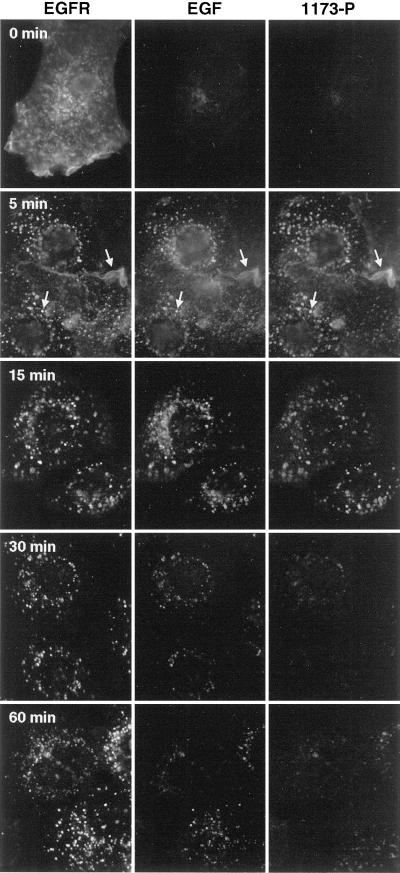
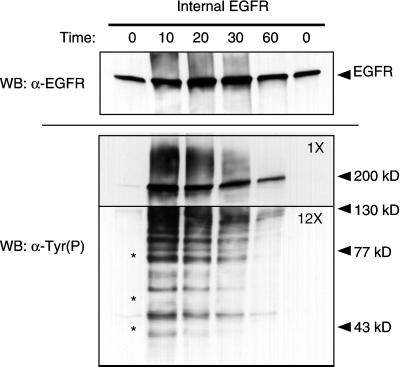
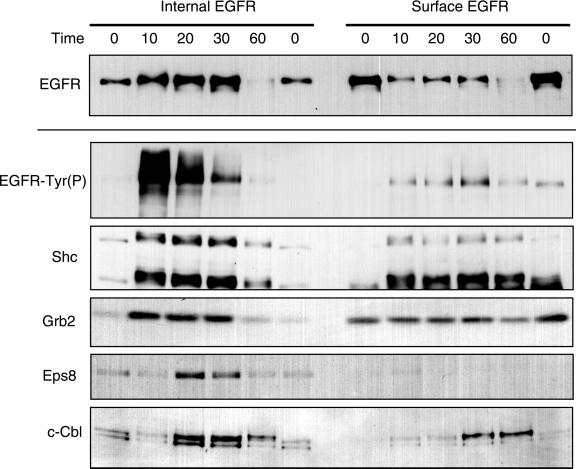
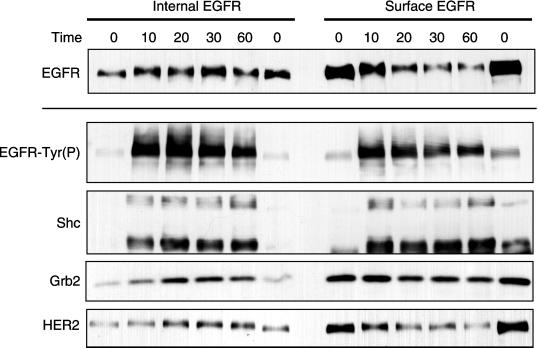
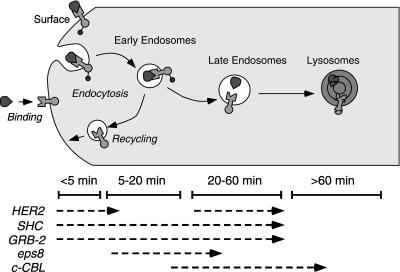
Ligand activation of the epidermal growth factor receptor (EGFR) leads to its rapid internalization and eventual delivery to lysosomes. This process is thought to be a mechanism to attenuate signaling, but signals could potentially be generated after endocytosis. To directly evaluate EGFR signaling during receptor trafficking, we developed a technique to rapidly and selectively isolate internalized EGFR and associated molecules with the use of reversibly biotinylated anti-EGFR antibodies. In addition, we developed antibodies specific to tyrosine-phosphorylated EGFR. With the use of a combination of fluorescence imaging and affinity precipitation approaches, we evaluated the state of EGFR activation and substrate association during trafficking in epithelial cells. We found that after internalization, EGFR remained active in the early endosomes. However, receptors were inactivated before degradation, apparently due to ligand removal from endosomes. Adapter molecules, such as Shc, were associated with EGFR both at the cell surface and within endosomes. Some molecules, such as Grb2, were primarily found associated with surface EGFR, whereas others, such as Eps8, were found only with intracellular receptors. During the inactivation phase, c-Cbl became EGFR associated, consistent with its postulated role in receptor attenuation. We conclude that the association of the EGFR with different proteins is compartment specific. In addition, ligand loss is the proximal cause of EGFR inactivation. Thus, regulated trafficking could potentially influence the pattern as well as the duration of signal transduction.


Figures

Figure 1
Figure 1
Protocol for separating internalized vs. surface-associated EGFR. Details are in MATERIALS AND METHODS. GSH, reduced glutathione; Ab, antibody.
Figure 2
Figure 2
Anti-EGFR mAb 13A9 remains stably associated with the EGFR. (A) Cells were incubated with 100 ng/ml Btn-13A9 for 2 h at 37°C, and they were either left untreated (lane 1) or treated with 50 nM TGF-α (lanes 2 and 3) or EGF (lanes 4 and 5) for 15 min. Extracts were prepared in either the presence (lanes 3 and 5) or absence (lanes 2 and 4) of a 500-fold molar excess of competitive mAb 225. Total EGFR, identified in lane 1, was isolated from parallel cell extracts with the use of 2 μg of Btn-13A9. After precipitation of the Btn-13A9 with streptavidin agarose, Western blots were made and probed with anti-EGFR antibodies (top) or anti-Tyr(P) antibodies (bottom). (B) Cells were incubated with 100 ng/ml Btn-225 for 2 h at 37°C, and they were either left untreated (lane 1) or treated with 2 nM EGF for 15 min (lanes 2 and 3). Extracts were prepared in either the presence (lanes 3) or absence (lanes 1 and 2) of a 100-fold molar excess of competitive mAb 225. Extracts were analyzed as described for A. (C) Efficiency of strip and precipitation steps. Cells were incubated with Btn-13A9 on ice for 2 h. Parallel plates were treated with or without the glutathione strip solution as indicated. Both plates were serially treated with streptavidin agarose (first step) and then rabbit anti-mouse coupled to protein A agarose (second step). Western blots of the precipitates were visualized with anti-EGFR. −, without; +, with.
Figure 3
Figure 3
Trafficking kinetics of EGFR in complex with Btn-13A9. (A) Cells were incubated for 2 h at 4°C in the presence of 500 ng/ml Btn-13A9. Cells were washed and 50 nM EGF in prewarmed medium was added for the indicated number of minutes. Surface-associated biotin was removed with glutathione and internal and surface EGFR were isolated as described in MATERIALS AND METHODS. Shown are Western blots of the precipitates visualized with anti-EGFR. (B) Cells were incubated with 200 ng/ml Btn-13A9 for 60 min at 37°C in the absence (left, −) or presence (right, +) of 50 nM EGF. Cells were then fixed, permeabilized, and stained with Texas Red-labeled streptavidin.
Figure 4
Figure 4
Complexes of Btn-13A9–EGFR pass sequentially through early endosomes and into lysosomes. The trafficking of Btn-13A9 was followed with the use of confocal fluorescence microscopy. Cells were incubated with 200 ng/ml Btn-13A9 for 2 h at 37°C before adding EGF for 5, 15, and 60 min. Cells were stained simultaneously with Texas Red streptavidin and Alexa-488–labeled anti-EEA1 (A) or anti-LAMP-2 (B). The images were converted to binary format and a Boolean “AND” operation was used to generate the overlapping pixel pattern. The percentage of total pixels in the EGFR image that colocalized to the appropriate markers is indicated.
Figure 5
Figure 5
Loss of EGFR tyrosine phosphorylation precedes receptor degradation. (A) Btn-13A9 (500 ng/ml) was bound to cells, and 50 nM EGF was added for the indicated periods on time at 37°C. Internal EGFR were isolated as described in MATERIALS AND METHODS, and receptor mass and Tyr(P) levels were determined in parallel Western blots (WB). Total EGFR levels were determined by immunoprecipitation of an extracted parallel plate with 4 μg/ml mAb 225. (B) Bands in A were quantified by densitometry. EGFR (○) bands were normalized to a percentage of the zero-time point. Tyr(P) (●) was normalized to the 20-min time point.
Figure 6
Figure 6
Loss of phosphorylated EGFR reflects loss of ligand rather than the receptor. Cells incubated for the indicated amount of time with Texas Red-labeled EGF were fixed, permeabilized, and stained with Alexa-488–labeled mAb 13A9 and affinity-purified sheep antibodies against a peptide corresponding to the major tyrosine phosphorylation site of the EGFR (1173-P). The latter was visualized with an affinity-purified Cy5-labeled anti-sheep antibody. The three fluorescent labels were visualized sequentially with the use of a multiband filter set. The exposure time for each wavelength was constant with the use of the 15-min sample as the standard. The arrows at 5 min indicate a corresponding vesicle and membrane ruffle in the three images. 0 min indicates no treatment with EGF.
Figure 7
Figure 7
Internalized EGFR are associated with multiple tyrosine phosphorylated proteins. Btn-13A9 (500 ng/ml) was bound to cells at 37°C, followed by the addition of 50 nM EGF for the indicated periods of time. After removal of surface-associated biotin, internalized Btn-13A9–EGFR complexes were isolated with the use of a 45-min incubation at 0°C. Isolated complexes were separated on 5–10% gradient gels, and levels of EGFR were determined by Western blots (top, WB). Total tyrosine phosphorylated proteins were detected with horseradish peroxidase-conjugated RC-20 antibody (bottom). To prevent the heavily tyrosine-phosphorylated EGFR from obscuring minor proteins, the top part of the gel was exposed for 5 s (1×), whereas the bottom part of the gel was exposed for 1 min (12×). A parallel gel was probed for Shc and the three isoforms ran with the same mobility as the bands marked by asterisks.
Figure 8
Figure 8
Multiple proteins associate with both surface and internal EGFR in 184A1 cells. Cells incubated with 500 ng/ml Btn-13A9 were treated with 50 nM EGF for the indicated time periods. Internal and surface EGFR were isolated from cells, and the resulting Western blots were visualized with the use of antibodies specific for EGFR, Tyr(P), Shc, Grb2, c-Cbl, and Eps8. All blots are from a single experiment run on the same day. The results are typical based on a minimum of three experiments for each marker.
Figure 9
Figure 9
Proteins associated with both surface and internal EGFR in HB2 cells. Cells incubated with 500 ng/ml Btn-13A9 were treated with 50 nM EGF for the indicated time periods. Internal and surface EGFR were isolated from cells, and the resulting Western blots were visualized with the use of antibodies specific for EGFR, Tyr(P), Shc, Grb2, and HER2. All blots are from a single experiment run on the same day.
Figure 10
Figure 10
Summary of trafficking and signaling of EGFR in human mammary epithelial cells. Shown is a simplified diagram of the endocytic pathway. Listed below is the time period during which the EGFR traverses the different compartments after EGF addition as determined by colocalization studies. The association of different substrates with the EGFR is based on results from both 184A1 and HB2 cells.

References

    1. Adamson P, Paterson HF, Hall A. Intracellular localization of the P21rho proteins. J Cell Biol. 1992;119:617–627. - PMC - PubMed
    1. Ahn S, Maudsley S, Luttrell LM, Lefkowitz RJ, Daaka Y. Src-mediated tyrosine phosphorylation of dynamin is required for beta2- adrenergic receptor internalization and mitogen-activated protein kinase signaling. J Biol Chem. 1999;274:1185–1188. - PubMed
    1. Aroian RV, Koga M, Mendel JE, Ohshima Y, Sternberg PW. The let-23 gene necessary for Caenorhabditis elegans vulval induction encodes a tyrosine kinase of the EGF receptor subfamily. Nature. 1990;348:693–699. - PubMed
    1. Baass PC, Guglielmo FA, Posner BI, Bergeron JM. Compartmentalized signal transduction by receptor tyrosine kinases. Trends Cell Biol. 1995;5:465–470. - PubMed
    1. Band V, Sager R. Distinctive traits of normal and tumor-derived human mammary epithelial cells expressed in a medium that supports long-term growth of both cell types. Proc Natl Acad Sci USA. 1989;86:1249–1253. - PMC - PubMed

Publication types

MeSH terms