. 2001 Jun 15;29(12):2471-8.
doi: 10.1093/nar/29.12.2471.

Non-independence of Mnt repressor-operator interaction determined by a new quantitative multiple fluorescence relative affinity (QuMFRA) assay

Affiliations

Non-independence of Mnt repressor-operator interaction determined by a new quantitative multiple fluorescence relative affinity (QuMFRA) assay

T K Man et al. Nucleic Acids Res. .

Abstract

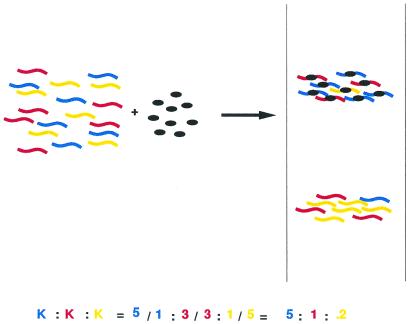
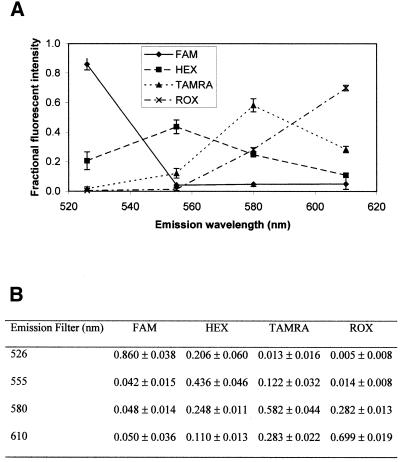
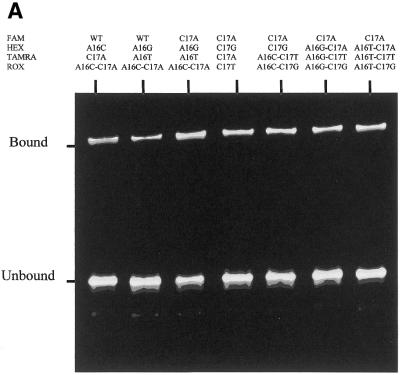
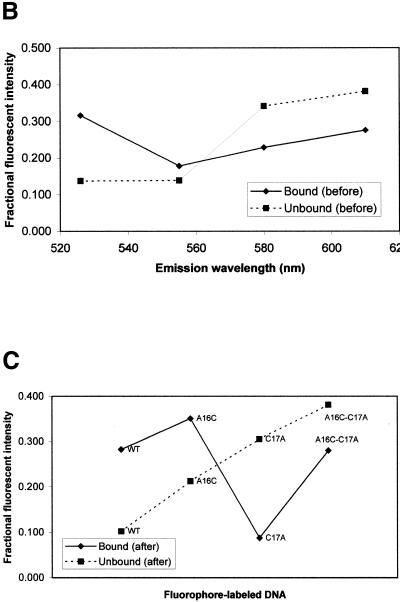
Salmonella bacteriophage repressor Mnt belongs to the ribbon-helix-helix class of transcription factors. Previous SELEX results suggested that interactions of Mnt with positions 16 and 17 of the operator DNA are not independent. Using a newly developed high-throughput quantitative multiple fluorescence relative affinity (QuMFRA) assay, we directly quantified the relative equilibrium binding constants (K(ref)) of Mnt to operators carrying all the possible dinucleotide combinations at these two positions. Results show that Mnt prefers binding to C, instead of wild-type A, at position 16 when wild-type C at position 17 is changed to other bases. The measured K(ref) values of double mutants were also higher than the values predicted from single mutants, demonstrating the non-independence of these two positions. The ability to produce a large number of quantitative binding data simultaneously and the potential to scale up makes QuMFRA a valuable tool for the large-scale study of macromolecular interaction.


Figures

Figure 1
Figure 1
The principle of QuMFRA assay to simultaneously determine multiple relative equilibrium binding constants (Kref). A mixture of three different DNA sequences (red, yellow and blue) is incubated with a DNA binding protein (black). After reaching equilibrium, the bound and unbound fractions of the mixture are separated by electrophoretic mobility shift assay. The Kref (blue:red:yellow = 5:1:0.2) are determined by simply measuring the ratios of each DNA in the bound and unbound fractions (see text for details).
Figure 2
Figure 2
The emission spectra (A) and the emission matrix E (B) of the four fluorophores used in QuMFRA and deconvolution. SK-1 oligos (1 µM) labeled with FAM, HEX, TAMRA or ROX were analyzed on a 10% polyacrylamide gel. The bands were then scanned and quantified by Typhoon Variable Scanner using emission filters as indicated. The values (fractional fluorescent intensities) in both emission spectrum and emission matrix E are the fraction of the fluorescence intensity of a fluorophore in one emission wavelength divided by the total fluorescence intensity of that fluorophore in all four emission wavelengths. The sum of the fractional fluorescent intensities of a fluorophore in all four emission wavelengths is equal to 1. The values shown in (B) are the means and standard deviations from five independent measurements.
Figure 3
Figure 3
QuMFRA assay. (A) 10% polyacrylamide gel containing bound and unbound fractions of wild-type Mnt protein and operator DNA sequence containing mutations in positions 16 and 17. DNA molecules were labeled with FAM, HEX, TAMRA or ROX as indicated. Each bound and unbound fraction contained different ratios of fluorophore-labeled DNAs. Each lane contained ∼50 nM of active tetrameric Mnt protein and 100 nM of the four fluorophore-labeled DNA molecules. The gel was scanned and quantified as described in Materials and Methods. The fractional fluorescent intensities of the bound and unbound fractions of the four fluorophore-labeled DNA molecules in lane 1 of (A) before (B) and after (C) deconvolution. Fractional fluorescent intensity is calculated as the intensity at one emission wavelength divided by the sum of the intensities at all four emission wavelengths. Before the deconvolution, the fluorescent intensity at each emission wavelength contains fluorescence contributions from all four fluorophores. The deconvolution method described in the text converts these mixtures of fluorescent intensities into the fluorescent intensity of each fluorophore-labeled DNA, which is proportional to the actual amount of the DNA.
Figure 3
Figure 3
QuMFRA assay. (A) 10% polyacrylamide gel containing bound and unbound fractions of wild-type Mnt protein and operator DNA sequence containing mutations in positions 16 and 17. DNA molecules were labeled with FAM, HEX, TAMRA or ROX as indicated. Each bound and unbound fraction contained different ratios of fluorophore-labeled DNAs. Each lane contained ∼50 nM of active tetrameric Mnt protein and 100 nM of the four fluorophore-labeled DNA molecules. The gel was scanned and quantified as described in Materials and Methods. The fractional fluorescent intensities of the bound and unbound fractions of the four fluorophore-labeled DNA molecules in lane 1 of (A) before (B) and after (C) deconvolution. Fractional fluorescent intensity is calculated as the intensity at one emission wavelength divided by the sum of the intensities at all four emission wavelengths. Before the deconvolution, the fluorescent intensity at each emission wavelength contains fluorescence contributions from all four fluorophores. The deconvolution method described in the text converts these mixtures of fluorescent intensities into the fluorescent intensity of each fluorophore-labeled DNA, which is proportional to the actual amount of the DNA.

References

    1. Sauer R.T., Krovatin,W., DeAnda,J., Youderian,P. and Susskind,M.M. (1983) Primary structure of the immI immunity region of bacteriophage P22. J. Mol. Biol., 168, 699–713. - PubMed
    1. Raumann B.E., Rould,M.A., Pabo,C.O. and Sauer,R.T. (1994) DNA recognition by β-sheets in the Arc repressor–operator crystal structure. Nature, 367, 754–757. - PubMed
    1. Vershon A.K., Youderian,P., Susskind,M.M. and Sauer,R.T. (1985) The bacteriophage P22 arc and mnt repressors. Overproduction, purification and properties. J. Biol. Chem., 260, 12124–12129. - PubMed
    1. Vershon A.K., Liao,S.M., McClure,W.R. and Sauer,R.T. (1987) Bacteriophage P22 Mnt repressor. DNA binding and effects on transcription in vitro. J. Mol. Biol., 195, 311–322. - PubMed
    1. Knight K.L., Bowie,J.U., Vershon,A.K., Kelley,R.D. and Sauer,R.T. (1989) The Arc and Mnt repressors. A new class of sequence-specific DNA-binding protein. J. Biol. Chem., 264, 3639–3642. - PubMed

Publication types