

Genomewide linkage analysis of stature in multiple populations reveals several regions with evidence of linkage to adult height
- PMID: 11410839
- PMCID: PMC1226025
- DOI: 10.1086/321287
Genomewide linkage analysis of stature in multiple populations reveals several regions with evidence of linkage to adult height
Abstract
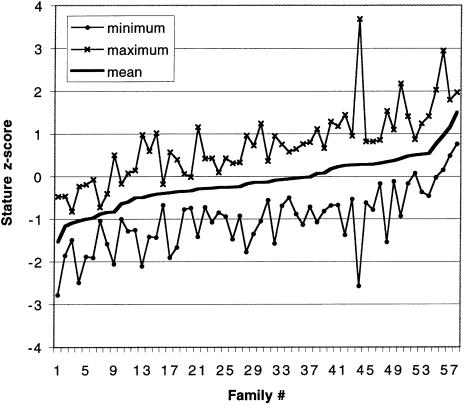
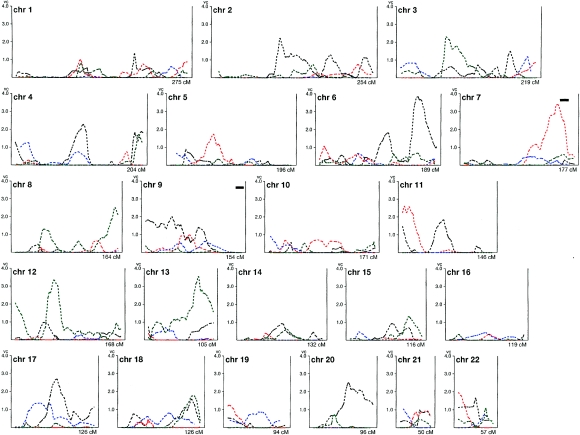
Genomewide linkage analysis has been extremely successful at identification of the genetic variation underlying single-gene disorders. However, linkage analysis has been less successful for common human diseases and other complex traits in which multiple genetic and environmental factors interact to influence disease risk. We hypothesized that a highly heritable complex trait, in which the contribution of environmental factors was relatively limited, might be more amenable to linkage analysis. We therefore chose to study stature (adult height), for which heritability is approximately 75%-90% (Phillips and Matheny 1990; Carmichael and McGue 1995; Preece 1996; Silventoinen et al. 2000). We reanalyzed genomewide scans from four populations for which genotype and height data were available, using a variance-components method implemented in GENEHUNTER 2.0 (Pratt et al. 2000). The populations consisted of 408 individuals in 58 families from the Botnia region of Finland, 753 individuals in 183 families from other parts of Finland, 746 individuals in 179 families from Southern Sweden, and 420 individuals in 63 families from the Saguenay-Lac-St.-Jean region of Quebec. Four regions showed evidence of linkage to stature: 6q24-25, multipoint LOD score 3.85 at marker D6S1007 in Botnia (genomewide P<.06), 7q31.3-36 (LOD 3.40 at marker D7S2195 in Sweden, P<.02), 12p11.2-q14 (LOD 3.35 at markers D12S10990-D12S398 in Finland, P<.05) and 13q32-33 (LOD 3.56 at markers D13S779-D13S797 in Finland, P<.05). In a companion article (Perola et al. 2001 [in this issue]), strong supporting evidence is obtained for linkage to the region on chromosome 7. These studies suggest that highly heritable complex traits such as stature may be genetically tractable and provide insight into the genetic architecture of complex traits.
Figures
References
Electronic-Database Information
-
- Authors' Web site, http://www-genome.wi.mit.edu/publications/stature (for LOD scores for the complete genomewide scans)
-
- Généthon, http://www.genethon.fr/
-
- Genome Database, http://gdbwww.gdb.org/
References
-
- Carmichael CM, McGue M (1995) A cross-sectional examination of height, weight, and body mass index in adult twins. J Gerontol A Biol Sci Med Sci 50:B237–B244 - PubMed
-
- Forsen T, Eriksson J, Qiao Q, Tervahauta M, Nissinen A, Tuomilehto J (2000) Short stature and coronary heart disease: a 35-year follow-up of the Finnish cohorts of The Seven Countries Study. J Intern Med 248:326–332 - PubMed
-
- Garnero P, Borel O, Grant SF, Ralston SH, Delmas PD (1998) Collagen Ialpha1 Sp1 polymorphism, bone mass, and bone turnover in healthy French premenopausal women: the OFELY study. J Bone Miner Res 13:813–817 - PubMed
Publication types
MeSH terms
Grants and funding
LinkOut - more resources
Full Text Sources
Molecular Biology Databases
