Major histocompatibility complex class II invariant chain expression in non-antigen-presenting cells
- PMID: 11412309
- PMCID: PMC1783233
- DOI: 10.1046/j.1365-2567.2001.01230.x
Major histocompatibility complex class II invariant chain expression in non-antigen-presenting cells
Abstract
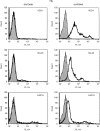
In contrast to the generally accepted belief, the major histocompatibility complex (MHC) class II invariant chain (Ii) is commonly expressed intracellularly in cells that do not present exogenous antigens. Such cells include resting peripheral blood T cells and natural killer (NK) cells. In T cells, the Ii is associated with a 77 000 molecular-weight molecule (p77) that has yet to be identified. This molecule is co-precipitated with the anti-Ii monoclonal antibody (mAb) VCD-1, but not with mAb BU-45. This suggests that in the p77-Ii complex, the extracellular epitope of Ii recognized by BU-45 is hidden, whereas the Ii epitope for VCD-1 remains exposed. In antigen-presenting cells (APCs), p77 association with the Ii was minimal, if detectable. The p77-Ii association in non-professional APCs suggests that the Ii may have another, more general, function other than the one accepted in antigen presentation.
Figures


Similar articles
-
Human invariant chain isoform p35 restores thymic selection and antigen presentation in CD74-deficient mice.Immunol Cell Biol. 2012 Oct;90(9):896-902. doi: 10.1038/icb.2012.27. Epub 2012 Jun 12. Immunol Cell Biol. 2012. PMID: 22689013
-
Two distinct class II molecules encoded by the genes within HLA-DR subregion of HLA-Dw2 and Dw12 can act as stimulating and restriction molecules.J Immunol. 1985 Aug;135(2):1288-98. J Immunol. 1985. PMID: 3159789
-
Class II major histocompatibility complex molecules of murine dendritic cells: synthesis, sialylation of invariant chain, and antigen processing capacity are down-regulated upon culture.Proc Natl Acad Sci U S A. 1991 Apr 15;88(8):3014-8. doi: 10.1073/pnas.88.8.3014. Proc Natl Acad Sci U S A. 1991. PMID: 2014224 Free PMC article.
-
Achieving stability through editing and chaperoning: regulation of MHC class II peptide binding and expression.Immunol Rev. 2005 Oct;207:242-60. doi: 10.1111/j.0105-2896.2005.00306.x. Immunol Rev. 2005. PMID: 16181341 Review.
-
Protein degradation in MHC class II antigen presentation: opportunities for immunomodulation.Semin Cell Dev Biol. 2000 Jun;11(3):203-10. doi: 10.1006/scdb.2000.0162. Semin Cell Dev Biol. 2000. PMID: 10906277 Review.
Cited by
-
Substance P increases cell-surface expression of CD74 (receptor for macrophage migration inhibitory factor): in vivo biotinylation of urothelial cell-surface proteins.Mediators Inflamm. 2009;2009:535348. doi: 10.1155/2009/535348. Epub 2009 Mar 22. Mediators Inflamm. 2009. PMID: 19325914 Free PMC article.
-
Altered positive selection due to corecognition of floppy peptide/MHC II conformers supports an integrative model of thymic selection.Proc Natl Acad Sci U S A. 2003 Apr 29;100(9):5354-9. doi: 10.1073/pnas.0831129100. Epub 2003 Apr 16. Proc Natl Acad Sci U S A. 2003. PMID: 12700352 Free PMC article.
-
Reactivity of HLADR antibody manifests expression of surface MHC II molecules on peripheral blood T lymphocytes in new world monkeys.Immun Inflamm Dis. 2024 Jun;12(6):e1318. doi: 10.1002/iid3.1318. Immun Inflamm Dis. 2024. PMID: 38923761 Free PMC article.
-
CD74 is a functional MIF receptor on activated CD4+ T cells.Cell Mol Life Sci. 2024 Jul 11;81(1):296. doi: 10.1007/s00018-024-05338-5. Cell Mol Life Sci. 2024. PMID: 38992165 Free PMC article.
References
-
- Sant AJ, Miller J. MHC class II antigen processing: biology of invariant chain. Curr Opin Immunol. 1994;6:57–63. - PubMed
-
- Veenstra H, Jacobs P, Dowdle EB. Processing of HLA-Class II invariant chain and expression of the p35 form is different in malignant and transformed cells. Blood. 1993;82:2494–500. - PubMed
-
- Veenstra H, Jacobs P, Dowdle EB. Abnormal association between invariant chain and HLA Class II α and β chains in chronic lymphocytic leukemia. Cell Immunol. 1996;171:68–73. 10.1006/cimm.1996.0174. - DOI - PubMed
-
- Stähli C, Miggioano V, Stocker J, Staehelin TH. Distinction of epitopes by monoclonal antibodies. Methods Enzymol. 1983;92:242–53. - PubMed
Publication types
MeSH terms
Substances
LinkOut - more resources
Full Text Sources
Research Materials
Miscellaneous

