. 2001 Jun;107(12):1563-9.
doi: 10.1172/JCI11234.

Endothelin-1/endothelin-B receptor-mediated increases in NHE3 activity in chronic metabolic acidosis

Affiliations

Endothelin-1/endothelin-B receptor-mediated increases in NHE3 activity in chronic metabolic acidosis

K Laghmani et al. J Clin Invest. 2001 Jun.

Abstract

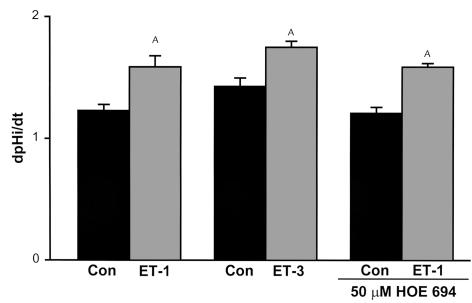
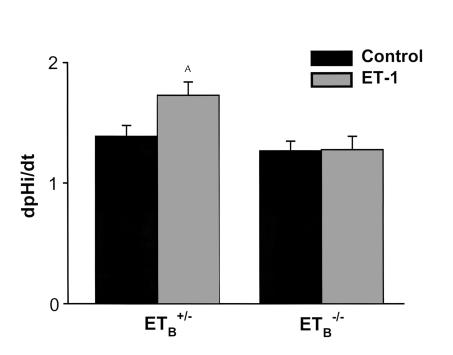
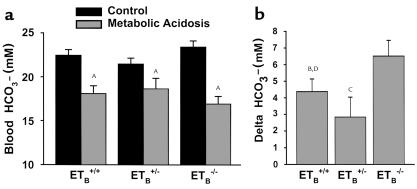
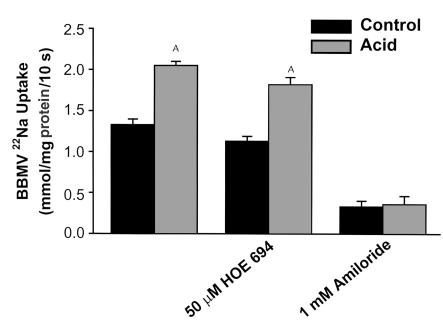
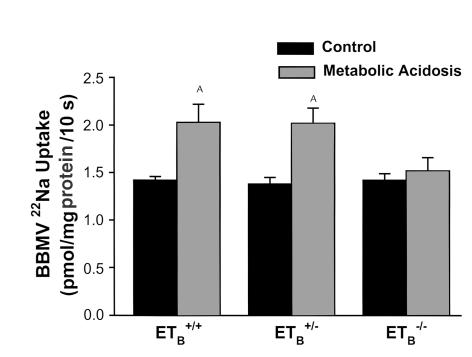
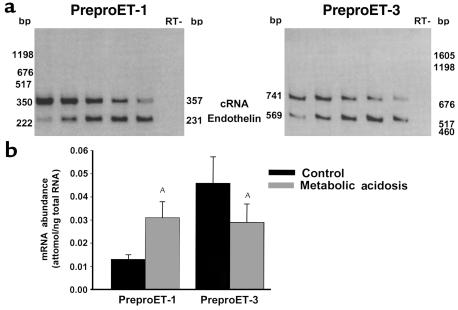
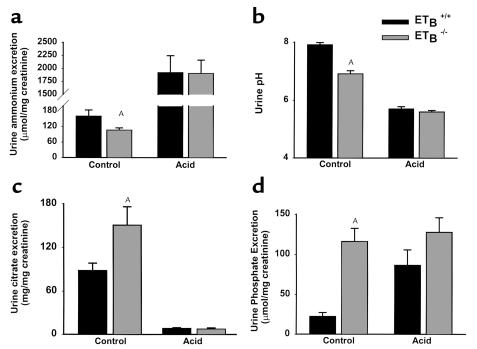
Decreases in blood pH activate NHE3, the proximal tubular apical membrane Na/H antiporter. In cultured renal epithelial cells, activation of the endothelin-B (ET(B)) receptor increases NHE3 activity. To examine the role of the ET(B) receptor in the response to acidosis in vivo, the present studies examined ET(B) receptor-deficient mice, rescued from neonatal lethality by expression of a dopamine beta-hydroxylase promoter/ET(B) receptor transgene (Tg/Tg:ET(B)(-/-) mice). In proximal tubule suspensions from Tg/Tg:ET(B)(+/-) mice, 10(-8) M endothelin-1 (ET-1) increased NHE3 activity, but this treatment had no effect on tubules from Tg/Tg:ET(B)(-/-) mice. Acid ingestion for 7 days caused a greater decrease in blood HCO(3)(-) concentration in Tg/Tg:ET(B)(-/-) mice compared with Tg/Tg:ET(B)(+/+) and Tg/Tg:ET(B)(+/-) mice. Whereas acid ingestion increased apical membrane NHE3 by 42-46% in Tg/Tg:ET(B)(+/+) and Tg/Tg:ET(B)(+/-) mice, it had no effect on NHE3 in Tg/Tg:ET(B)(-/-) mice. In C57BL/6 mice, excess acid ingestion increased renal cortical preproET-1 mRNA expression 2.4-fold and decreased preproET-3 mRNA expression by 37%. On a control diet, Tg/Tg:ET(B)(-/-) mice had low rates of ammonium excretion, which could not be attributed to an inability to acidify the urine, as well as hypercitraturia, with increased titratable acid excretion. Acid ingestion increased ammonium excretion, citrate absorption, and titratable acid excretion to the same levels in Tg/Tg:ET(B)(-/-) and Tg/Tg:ET(B)(+/+) mice. In conclusion, metabolic acidosis increases ET-1 expression, which increases NHE3 activity via the ET(B) receptor.


Figures

Figure 1
Figure 1
NHE3 is activated via the ETB receptor. 10–8 M ET-1 with or without 50 mM HOE694, or 10–8 M ET-3, was added to suspensions of mouse proximal tubules from C57BL/6 mice, and Na/H antiporter activity was assessed as the rate of Na-dependent cell pH recovery from an acid load (dpHi/dt). ET-1: n = 11; ET-3: n = 6; ET-1 + HOE694: n = 7 (Con, control) and n = 6 (ET-1). AP < 0.05.
Figure 2
Figure 2
ET-1 activates NHE3 in mouse proximal tubules via the ETB receptor. 10–8 M ET-1 was added to suspensions of mouse proximal tubules from Tg/Tg:ETB+/– and Tg/Tg:ETB–/– mice, and Na/H antiporter activity was assessed as the rate of Na-dependent cell pH recovery from an acid load (dpHi/dt). Tg/Tg:ETB+/–, n = 6; Tg/Tg:ETB–/–, n = 9. AP < 0.05.
Figure 3
Figure 3
Chronic acid feeding causes a more severe acidosis in Tg/Tg:ETB–/– mice. Tg/Tg:ETB+/+, Tg/Tg:ETB+/–, and Tg/Tg:ETB–/– mice were fed control or acid diets (metabolic acidosis) for 7 days. Arterial blood gases were measured, and the measured pH and pCO2 were used to calculate blood HCO3 concentration. (a) Blood HCO3 levels. AP < 0.05 versus control (b). Acid-induced change in blood HCO3 levels. BP = 0.06, CP < 0.05 versus Tg/Tg:ETB–/–; DP = NS versus Tg/Tg:ETB+/–. Tg/Tg:ETB+/+, n = 12; Tg/Tg:ETB+/–, n = 12; and Tg/Tg:ETB–/–, n = 14.
Figure 4
Figure 4
NHE3 mediates Na/H antiporter activity in control and acid conditions. Na/H antiporter activity was assayed as 22Na uptake in BBMVs prepared from renal cortex of control and acid-fed mice. Without inhibitors: n = 4; HOE 694: n = 4; Amiloride: n = 3. AP < 0.05.
Figure 5
Figure 5
Chronic acid feeding does not increase NHE3 activity in Tg/Tg:ETB–/– mice. Tg/Tg:ETB+/+, Tg/Tg:ETB+/–, and Tg/Tg:ETB–/– mice were fed control or acid diets (metabolic acidosis) for 7 days. BBMVs were isolated from renal cortex and NHE3 activity measured as pH gradient–driven 22Na uptake. Tg/Tg:ETB+/+, n = 4; Tg/Tg:ETB+/–, n = 4; and Tg/Tg:ETB–/–, n = 5. AP < 0.05.
Figure 6
Figure 6
Acid feeding increases preproET-1 mRNA expression in wild-type mice. C57BL/6 mice were fed control or acid diets (metabolic acidosis) for 7 days. PreproET-1 and preproET-3 mRNA abundance were measured by competitive RT-PCR, using a heterologous competitive RNA template. (a) Typical experiment. Sample quantities were 1.4 μg (preproET-1) and 0.7 μg (preproET-3) total renal cortical RNA. Template quantities (cRNA, attomoles) were for preproET-1: lane 1, 51.8; lane 2, 10.4; lane 3, 2.6; lane 4, 1.3; and lane 5, 0.65; and for preproET-3: lane 1, 119.3; lane 2, 59.6; lane 3, 29.8; lane 4, 14.9; and lane 5, 7.5. (b) Summary of results. PreproET-1, n = 6; PreproET-3, n = 5. AP < 0.05.
Figure 7
Figure 7
Effects of acid feeding on urinary excretion in Tg/Tg:ETB+/+ and Tg/Tg:ETB–/– mice. Urine was collected from Tg/Tg:ETB+/+ and Tg/Tg:ETB–/– mice at baseline and after 7 days of acid ingestion. Samples were analyzed for (a) ammonium, (b) pH, (c) citrate, (d) phosphate, and creatinine concentrations. Urinary ammonium, citrate, and phosphate excretion are expressed as the ratio of their respective urinary concentrations to the creatinine concentration measured on the same sample. Ammonium: control, n = 19; acid, n = 8. Urine pH: control, n = 21; acid n = 10 (Tg/Tg:ETB+/+), n = 9 (Tg/Tg:ETB–/–). Citrate: control, n = 14 (Tg/Tg:ETB+/+), n = 15 (Tg/Tg:ETB–/–); acid, n = 7. Phosphate: control, n = 14 (Tg/Tg:ETB+/+), n = 15 (Tg/Tg:ETB–/–); acid, n = 7. AP < 0.05.
Figure 8
Figure 8
Acid feeding increases PEPCK mRNA in Tg/Tg:ETB+/+ and Tg/Tg:ETB–/– mice. Tg/Tg:ETB+/+ and Tg/Tg:ETB–/– mice were fed control or acid diets for 7 days. PEPCK mRNA abundance was measured on total renal cortical RNA by northern blot and normalized for 18S rRNA abundance. C, control; A, acid. Tg/Tg:ETB+/+, n = 3. Tg/Tg:ETB–/–, n = 5.

References

    1. Ambühl PM, et al. Chronic metabolic acidosis increases NHE3 protein abundance in rat kidney. Am J Physiol. 1996;271:F917–F925. - PubMed
    1. Wu MS, Biemesderfer D, Giebisch G, Aronson P. Role of NHE3 in mediating renal brush border Na+-H+ exchange. Adaptation to metabolic acidosis. J Biol Chem. 1996;271:32749–32752. - PubMed
    1. Amemiya M, Yamaji Y, Cano A, Moe OW, Alpern RJ. Acid incubation increases NHE-3 mRNA abundance in OKP cells. Am J Physiol. 1995;269:C126–C133. - PubMed
    1. Guntupalli J, DuBose TD. Effects of endothelin on rat renal proximal tubule Na-Pi cotransport and Na-H exchange. Am J Physiol. 1994;266:F658–F666. - PubMed
    1. Eiam-Ong S, Hilden SA, King AJ, Johns CA, Madias NE. Endothelin-1 stimulates the apical Na/H and Na/HCO3 transporters in rabbit renal cortex. Kidney Int. 1992;42:18–24. - PubMed

Publication types

MeSH terms