

Target cell populations of human immunodeficiency virus type 1 in peripheral blood lymphocytes with different chemokine receptors at various stages of disease progression
- PMID: 11413305
- PMCID: PMC114361
- DOI: 10.1128/JVI.75.14.6384-6391.2001
Target cell populations of human immunodeficiency virus type 1 in peripheral blood lymphocytes with different chemokine receptors at various stages of disease progression
Abstract
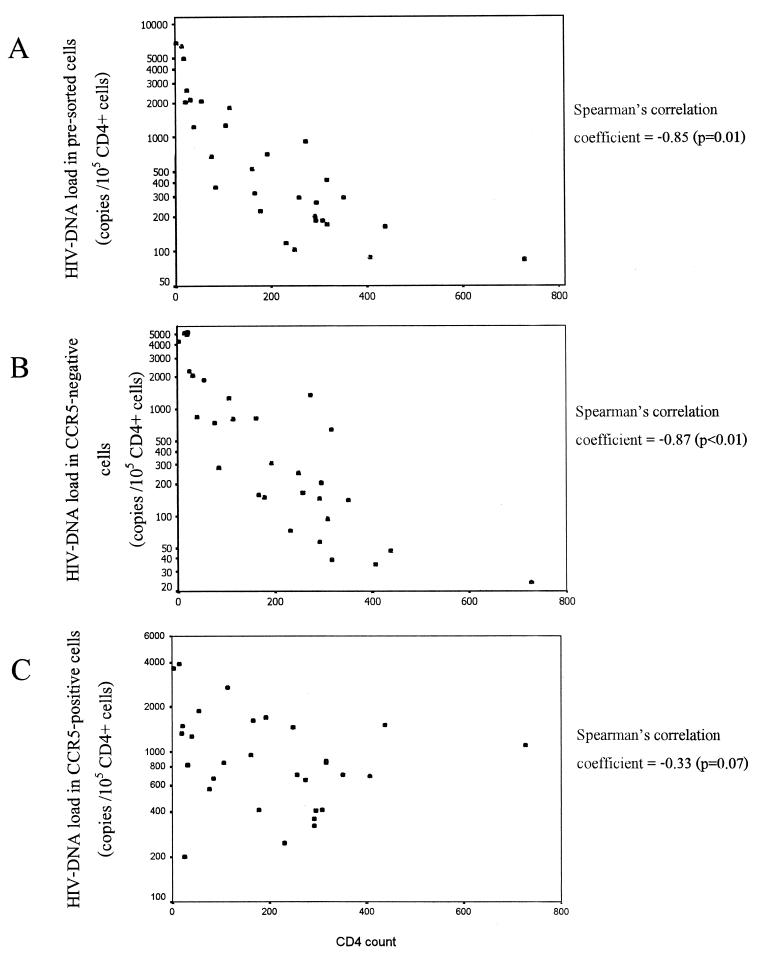
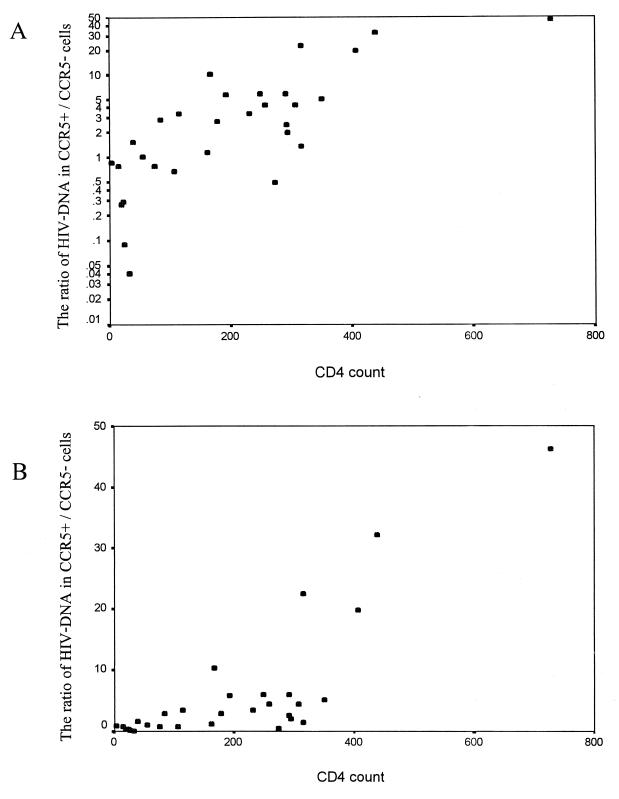
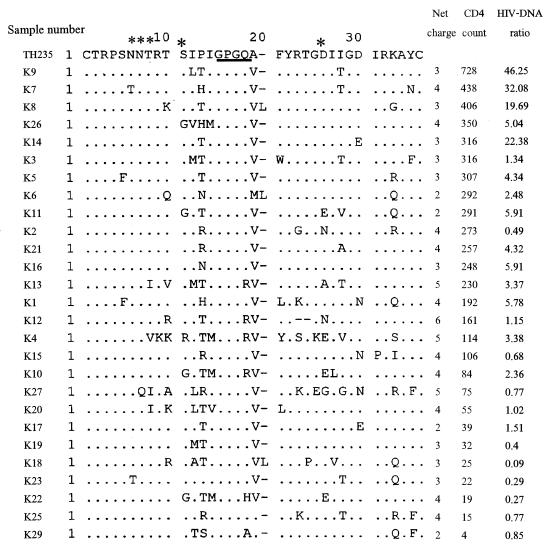
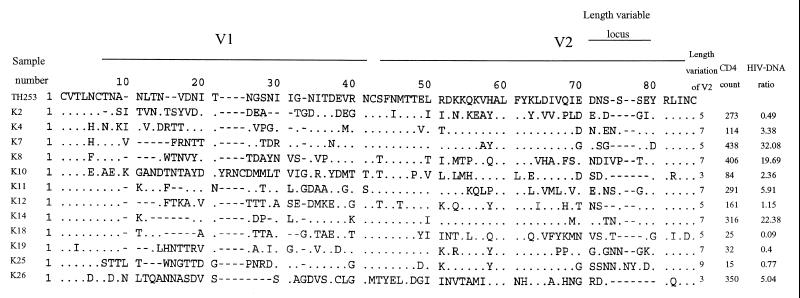
We studied the distribution of human immunodeficiency virus type 1 (HIV-1) DNA in CCR5-positive and -negative peripheral blood lymphocyte populations in HIV-1-infected individuals. While HIV-1 DNA in the CCR5-positive population showed no correlation with CD4 count, the increase of total HIV-1 DNA with lower CD4 count was mainly contributed by the increase of HIV-1 DNA in the CCR5-negative population. This might indicate the change in coreceptor usage from CCR5 to CXCR4 in later stages of disease progression. However, some of the samples with a high viral DNA load in the CCR5-negative population did not have any characteristic of the V3 loop sequence that is compatible with CXCR4 usage or the syncytium-inducing (SI) phenotype. We also did not find any known characteristic change predictive of the SI phenotype in V1 and V2 sequences. Our findings showed that there might be a shift in target cell populations during disease progression, and this shift was not necessarily associated with the genetic changes characteristic of CXCR4 usage.
Figures
Similar articles
-
HIV-1 co-receptor usage based on V3 loop sequence analysis: preferential suppression of CXCR4 virus post HAART?Immunol Invest. 2011;40(6):597-613. doi: 10.3109/08820139.2011.569673. Epub 2011 Apr 25. Immunol Invest. 2011. PMID: 21513481 Clinical Trial.
-
[Biological characteristics of HIV-1 isolates circulating in China are linked to its env V3 loop sequence variability].Zhonghua Yi Xue Za Zhi. 2004 Dec 2;84(23):1968-72. Zhonghua Yi Xue Za Zhi. 2004. PMID: 15730807 Chinese.
-
Functional complementation of the envelope hypervariable V3 loop of human immunodeficiency virus type 1 subtype B by the subtype E V3 loop.Virology. 1999 May 10;257(2):491-501. doi: 10.1006/viro.1999.9670. Virology. 1999. PMID: 10329559
-
Differential coreceptor expression allows for independent evolution of non-syncytium-inducing and syncytium-inducing HIV-1.J Clin Invest. 2000 Oct;106(8):1039-52. doi: 10.1172/JCI7953. J Clin Invest. 2000. PMID: 11032864 Free PMC article.
-
Genotypic coreceptor analysis.Eur J Med Res. 2007 Oct 15;12(9):453-62. Eur J Med Res. 2007. PMID: 17933727 Review.
Cited by
-
Coevolution of RANTES sensitivity and mode of CCR5 receptor use by human immunodeficiency virus type 1 of the R5 phenotype.J Virol. 2004 Nov;78(21):11807-15. doi: 10.1128/JVI.78.21.11807-11815.2004. J Virol. 2004. PMID: 15479822 Free PMC article.
-
Selective expression of human immunodeficiency virus Nef in specific immune cell populations of transgenic mice is associated with distinct AIDS-like phenotypes.J Virol. 2009 Oct;83(19):9743-58. doi: 10.1128/JVI.00125-09. Epub 2009 Jul 15. J Virol. 2009. PMID: 19605470 Free PMC article.
References
-
- Auewarakul P, Sangsiriwut K, Pattanapanyasat K, Suwanagool S, Wasi C. Increase in activated CD4+ lymphocytes with CCR5 and CXCR4 in HIV type 1-infected persons. AIDS Res Hum Retrovir. 1999;15:1403–1404. - PubMed
-
- Chenine A L, Sattentau Q, Moulard M. Selective HIV-1-induced downmodulation of CD4 and coreceptors. Arch Virol. 2000;145:455–471. - PubMed
Publication types
MeSH terms
Substances
LinkOut - more resources
Full Text Sources
Medical
Research Materials
