Comparative Study
. 2001 Jul;75(14):6572-83.
doi: 10.1128/JVI.75.14.6572-6583.2001.

Mononuclear phagocyte differentiation, activation, and viral infection regulate matrix metalloproteinase expression: implications for human immunodeficiency virus type 1-associated dementia

Affiliations
Comparative Study

Mononuclear phagocyte differentiation, activation, and viral infection regulate matrix metalloproteinase expression: implications for human immunodeficiency virus type 1-associated dementia

A Ghorpade et al. J Virol. 2001 Jul.

Abstract

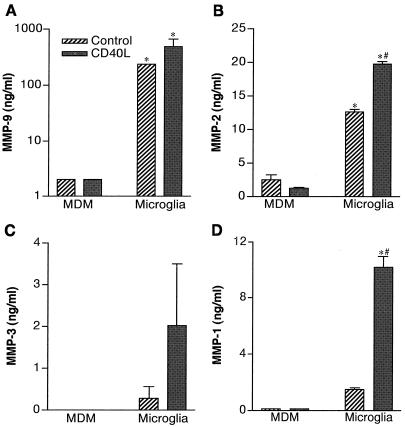
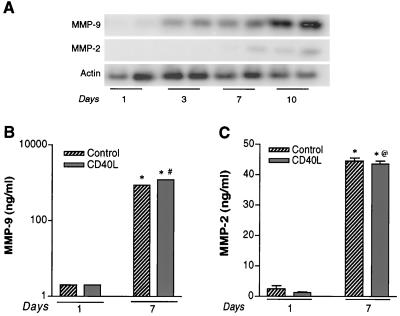
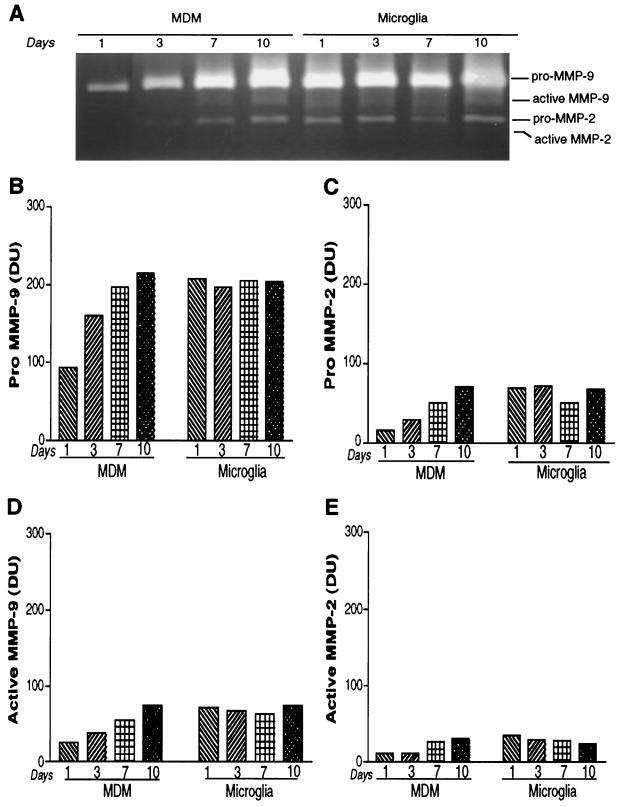
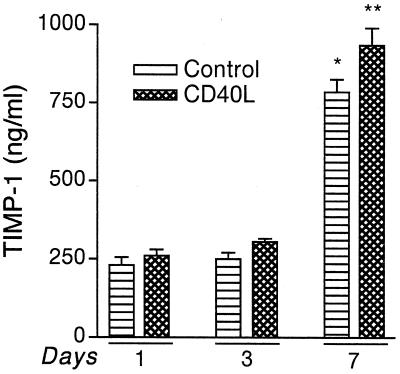
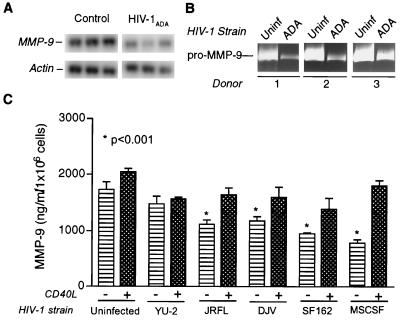
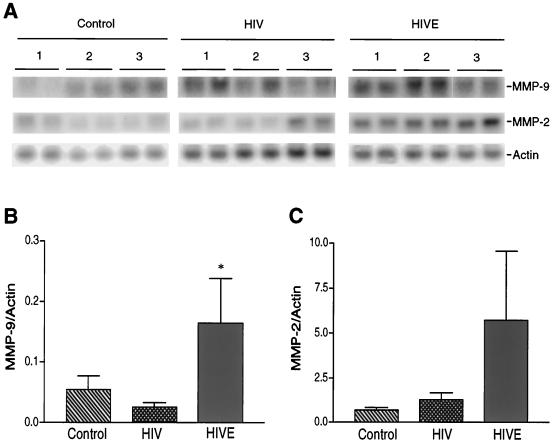
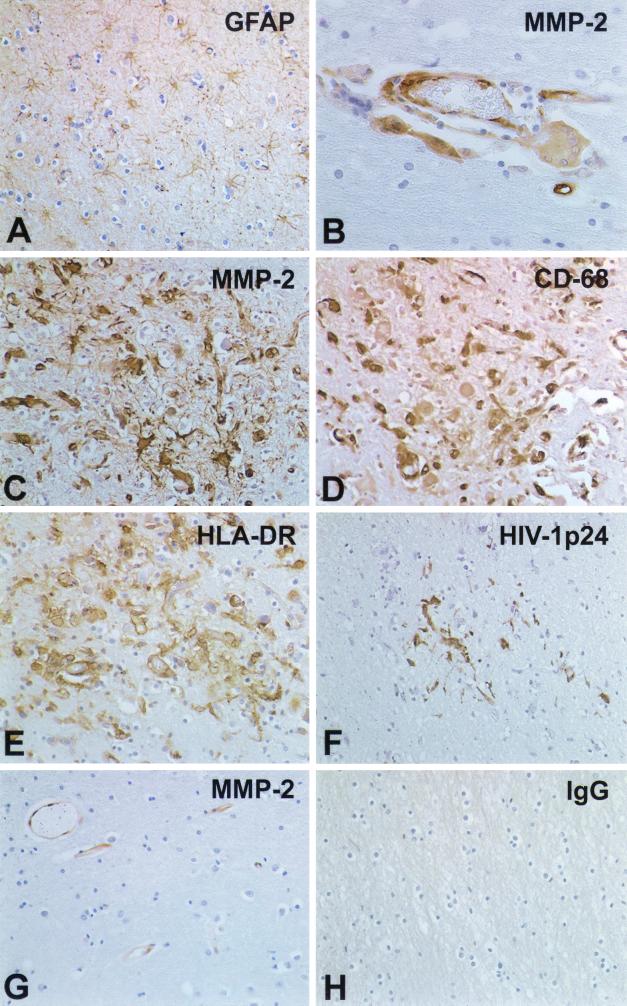
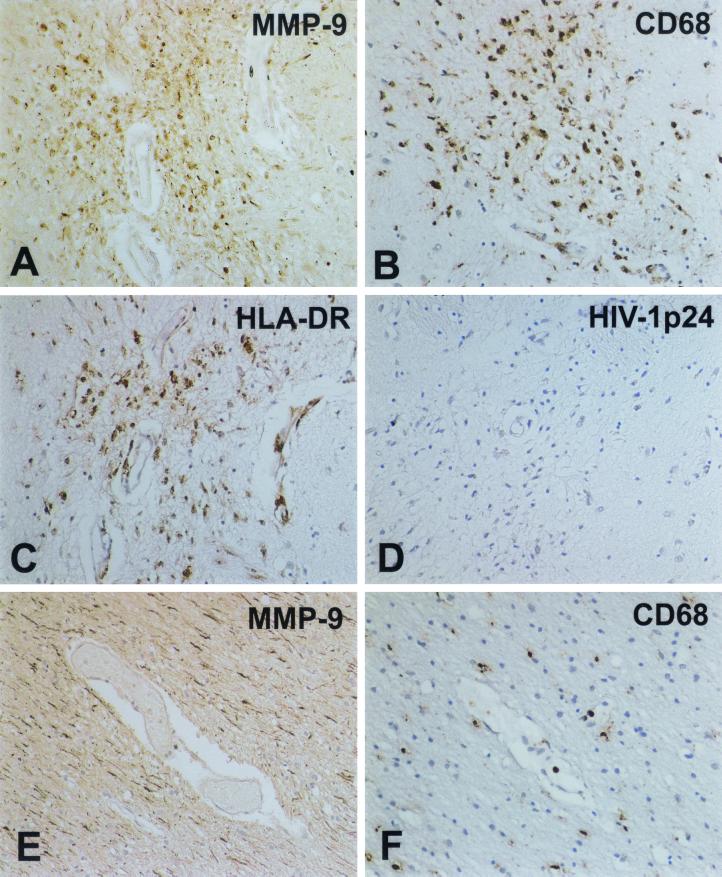
The pathogenesis of human immunodeficiency virus type 1 (HIV-1)-associated dementia (HAD) is mediated mainly by mononuclear phagocyte (MP) secretory products and their interactions with neural cells. Viral infection and MP immune activation may affect leukocyte entry into the brain. One factor that influences central nervous system (CNS) monocyte migration is matrix metalloproteinases (MMPs). In the CNS, MMPs are synthesized by resident glial cells and affect the integrity of the neuropil extracellular matrix (ECM). To ascertain how MMPs influence HAD pathogenesis, we studied their secretion following MP differentiation, viral infection, and cellular activation. HIV-1-infected and/or immune-activated monocyte-derived macrophages (MDM) and human fetal microglia were examined for production of MMP-1, -2, -3, and -9. MMP expression increased significantly with MP differentiation. Microglia secreted high levels of MMPs de novo that were further elevated following CD40 ligand-mediated cell activation. Surprisingly, HIV-1 infection of MDM led to the down-regulation of MMP-9. In encephalitic brain tissue, MMPs were expressed within perivascular and parenchymal MP, multinucleated giant cells, and microglial nodules. These data suggest that MMP production in MP is dependent on cell type, differentiation, activation, and/or viral infection. Regulation of MMP expression by these factors may contribute to neuropil ECM degradation and leukocyte migration during HAD.


Figures

FIG. 1
FIG. 1
MMP production in monocytes and human fetal microglia. Monocytes and microglia were isolated and then cultivated in medium with or without CD40L (2 μg/ml). Culture supernatants were collected at 72 h after CD40L stimulation, and MMP levels were determined by ELISA. Values represent the mean of triplicate determinations ± standard error. MMP-9 (A), MMP-2 (B), MMP-3 (C), and MMP-1 (D) levels were compared. Statistical tests were performed with GraphPad Prism 2.0, using one-way ANOVA with Newman-Keuls posttest. These demonstrated that microglia generated significantly higher levels of all MMPs when compared to monocytes (∗, P < 0.01). The effect of CD40L stimulation of microglial cells was also statistically significant for MMP-2 and -1 (#; P < 0.001).
FIG. 2
FIG. 2
Effect of MDM differentiation on MMP-9 and MMP-2 expression. (A) MDMs were cultured as adherent monolayers. Complete exchange with serum-free medium was performed on days 1, 3, 7, and 10. Total cellular RNA was analyzed for levels of MMP-9 and -2 by RT-PCR. Each time point was assayed in duplicate. Actin was utilized as an internal standard. A time-dependent increase in the levels of MMP RNA is shown. To assess the effect of immune activation in conjunction with differentiation, MDMs were stimulated with CD40L (2 μg/ml) on culture days 1 and 7. Culture supernatant samples were collected at 72 h after stimulation for MMP-9 (B) and MMP-2 (C) and tested by ELISA according to the manufacturer's instructions. At day 7 significantly larger amounts of both MMP-9 and -2 were generated compared to those from day 1 (∗, P < 0.001). MMP-9 production by MDMs was upregulated by CD40L at 7 days of cell cultivation (#, P < 0.001). MMP-2 did not show significant differences following cell activation (@, P > 0.05). Values represent the mean of triplicate determination ± standard error. Statistical analysis was performed with GraphPad Prism 2.0, using one-way ANOVA with Newman-Keuls posttest.
FIG. 3
FIG. 3
MDMs secrete pro- and active MMP-9 and MMP-2. MDMs and microglia were cultured as adherent monolayers. Complete medium exchange was performed at the time points indicated, and culture supernatants were tested by zymography after 72 h. A representative zymogram obtained from days 1, 3, 7, and 10 is shown in panel A. Levels of pro-MMP-9 (92 kDa) (B) and pro-MMP-2 (72 kDa) (C) and their active forms (active MMP-9 [D] and active MMP-2 [E], respectively) were quantified densitometrically and compared. Data are representative of a total of six MDM donors and two microglia donors performed three or more times on multiple gels.
FIG. 4
FIG. 4
Secretory levels of TIMP-1 produced by MDMs. Freshly elutriated monocytes were cultured as adherent monolayers. At days 1, 3, and 7, cells were stimulated with 2 μg of CD40L per ml for 72 h, and TIMP-1 levels in the culture supernatant were analyzed by ELISA. Each sample was analyzed in triplicate. Levels of TIMP-1 were upregulated 3.4-fold from day 1 to day 7 (∗, P < 0.001). In addition, CD40L stimulation led to a statistically significant increase in TIMP-1 levels in cells stimulated on day 7 of culture (∗∗, P < 0.001). Representative data obtained from a total of three donors are shown. Values represent the mean of triplicate determinations ± standard error. Statistical analysis was performed with GraphPad Prism 2.0, using one-way ANOVA with Newman-Keuls posttest.
FIG. 5
FIG. 5
Regulation of MMP expression in HIV-1-infected MDM. (A) Adherent monolayers of MDMs were maintained for 7 days prior to infection with HIV-1ADA. Triplicate wells of infected or uninfected control cells had complete medium exchange at day 5 postinfection. Cells were maintained for an additional 48 h. MDMs were harvested in TRIzol, and total RNA was extracted. MMP mRNA was detected by RT-PCR. Representative data for MMP-9 mRNA are shown. Actin was utilized as the internal standard for semiquantitative comparison. HIV-1ADA significantly down-regulated the levels of MMP-9 mRNA (A, ∗, P < 0.05). (B) MDMs were infected as described for panel A. MMP levels in culture supernatant samples from HIV-1-infected and uninfected cells were analyzed by zymography. Culture supernatant volumes were normalized on the basis of endpoint MTT activity. Three independent donors are represented. (C) Secretory profiles of MMP-9 in culture supernatant samples derived from uninfected and HIV-1-infected cells with or without CD40L stimulation were analyzed by ELISA. Three CNS HIV-1 isolates (HIV-1YU-2, HIV-1DJV, and HIV-1JR-FL) and two cerebrospinal fluid HIV-1 isolates (HIV-1SF162 and HIV-1MSCSF) were utilized. All isolates except for HIV-1YU-2 led to a significant down-regulation in MMP-9 levels in infected cells (∗, P < 0.001). CD40L stimulation led to a statistically significant upregulation in MMP-9 levels in uninfected and HIV-1-infected cells, with the exception of HIV-1YU-2 (P < 0.01). Statistical analysis was performed with GraphPad Prism 2.0, using one-way ANOVA with Newman-Keuls posttest.
FIG. 6
FIG. 6
Levels of MMP transcripts in human brain tissue. Total cellular RNA was extracted from frontal cortex and basal ganglia tissue obtained from three controls, five HIV-seropositive patients, and four HIVE patients. MMP-9 and -2 transcripts were detected by RT-PCR as described in Materials and Methods. Actin was used as an internal control for semiquantitative comparisons. Each sample was analyzed in duplicate determinations. Panel A illustrates three representative donors each from control, HIV-positive, and HIVE groups. Panels B and C summarize the data obtained with all patients investigated for MMP-9 and MMP-2 levels, respectively. Values represent the mean of duplicate determinations ± standard error. Statistical analysis was performed with GraphPad Prism 2.0, using one-way ANOVA with Newman-Keuls posttest. Levels of MMP-9 between HIVE and control brain tissue were significantly different (∗, P < 0.05).
FIG. 7
FIG. 7
Cellular localization of MMP-2 in human brain tissue. Fifteen brain autopsy samples were analyzed, including those from 3 control subjects (without CNS disease), 6 patients with severe HIVE, 3 patients with mild HIVE, and 3 HIV-1-seropositive patients without nervous system disease. In the patients with severe HIVE, prominent astrogliosis as identified by GFAP immunoreactivity was observed (A). HIV-1-infected multinucleated giant cells (B) expressed MMP-2 and were prominent in areas with significant monocyte infiltration. Serial sections stained with MMP-2 (C), CD68 (D), HLA-DR (E), and HIV-1 p24 (F) demonstrated activated, HIV-1-infected cells in microglial nodules positive for MMP-2. Control mouse IgG served as the negative control (H). Few MMP-2 antigen-positive endothelial cells were observed in the control samples (G). Sections are stained with GFAP (A), MMP-2 (B, C, and G), HLA-DR (E), HIV-1 p24 (F), and control IgG (H). Immunoreactivity was detected with a Vectastain Elite kit with DAB as a substrate. Tissue sections were counterstained with Mayer's hematoxylin. Original magnification, panels A and C to H, ×200; panel B, ×400.
FIG. 8
FIG. 8
MMP-9 localization in human brain tissue. Expression of MMP-9 was evaluated for all subjects as described for MMP-2. MMP-9 expression was detected on microglial nodules in brain tissue of HIV-1-seropositive patients devoid of neurological complications (A). Serial sections stained with CD68 (B [MP marker]) showed that some of these cells demonstrating MMP-9 reactivity were activated MPs. Importantly, the majority of MMP-9-positive cells expressed HLA-DR, a marker for activation (C), yet were minimally infected, as demonstrated by a lack of HIV-1 p24 detection (D). Interestingly, in a nonneurological control subject, MMP-9 immunoreactivity was observed mainly on linear axon-like processes (E) and was absent on MPs (F). Staining for MMP-9 (A and E), CD68 (B and F), HLA-DR (C), and HIV-1 p24 (D) is shown. Original magnifications: A to E, ×200; F, ×100.

References

    1. Belichenko P V, Miklossy J, Celio M R. HIV-I induced destruction of neocortical extracellular matrix components in AIDS victims. Neurobiol Dis. 1997;4:301–310. - PubMed
    1. Biggs T E, Cooke S J, Barton C H, Harris M P, Saksela K, Mann D A. Induction of activator protein 1 (AP-1) in macrophages by human immunodeficiency virus type-1 NEF is a cell-type-specific response that requires both hck and MAPK signaling events. J Mol Biol. 1999;290:21–35. - PubMed
    1. Bignami A, LeBlanc A, Perides G. A role for extracellular matrix degradation and matrix metalloproteinases in senile dementia? Acta Neuropathol. 1994;87:308–312. - PubMed
    1. Birkedal-Hansen H. Role of inflammatory mediators in tissue destruction. J Periodontal Res. 1993;28:500–510. - PubMed
    1. Bukrinsky M I, Nottet H S L M, Schmidtmayerova H, Dubrovsky L, Mullins M E, Lipton S A, Gendelman H E. Regulation of nitric oxide synthase activity in human immunodeficiency virus type 1 (HIV-1)-infected monocytes: implications for HIV-associated neurological disease. J Exp Med. 1995;181:735–745. - PMC - PubMed

Publication types

Substances