. 2001 Jun-Jul;22(6):1149-60.

Transient MR signal changes in patients with generalized tonicoclonic seizure or status epilepticus: periictal diffusion-weighted imaging

Affiliations

Transient MR signal changes in patients with generalized tonicoclonic seizure or status epilepticus: periictal diffusion-weighted imaging

J A Kim et al. AJNR Am J Neuroradiol. 2001 Jun-Jul.

Abstract

Background and purpose: Our purpose was to investigate transient MR signal changes on periictal MR images of patients with generalized tonicoclonic seizure or status epilepticus and to evaluate the clinical significance of these findings for differential diagnosis and understanding of the pathophysiology of seizure-induced brain changes.

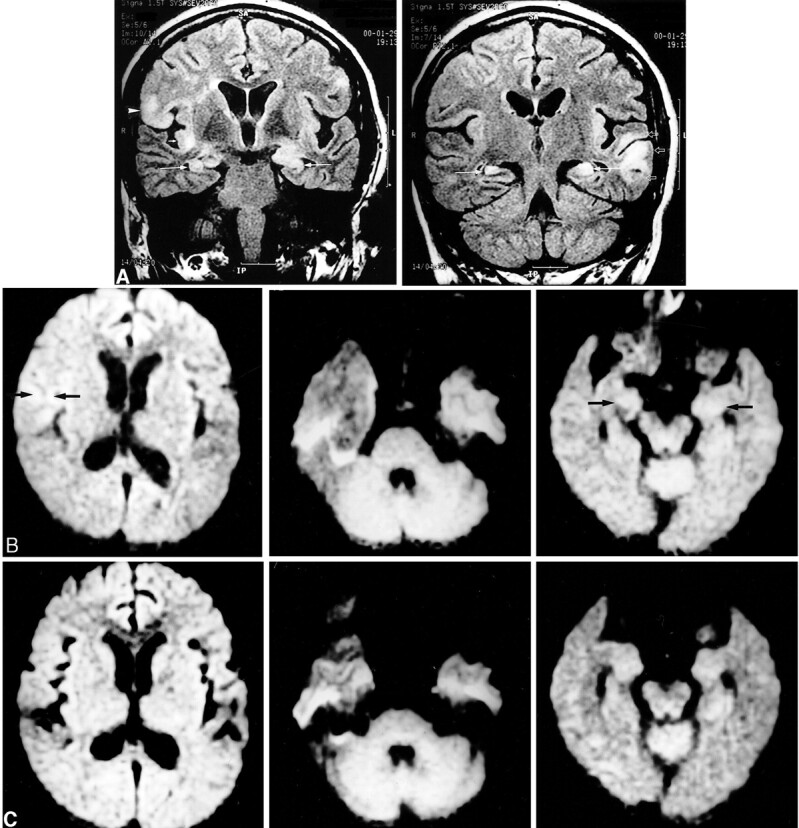
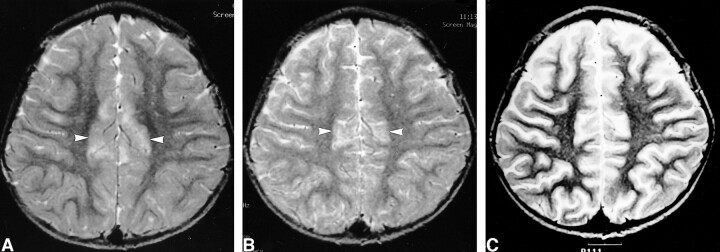
Methods: Eight patients with MR images that were obtained within 3 days after the onset of generalized tonicoclonic seizure or status epilepticus and that showed seizure-related MR signal changes had their records retrospectively reviewed. T1- and T2-weighted images were obtained of all eight patients. Additional diffusion-weighted images were obtained of five patients during initial examination. After adequate control of the seizure was achieved, follow-up MR imaging was performed. We evaluated the signal changes, location of the lesions, and degree of contrast enhancement on T1- and T2-weighted images and the signal change and apparent diffusion coefficient (ADC) on diffusion-weighted images. We also compared the signal changes of the initial MR images to those of the follow-up MR images.

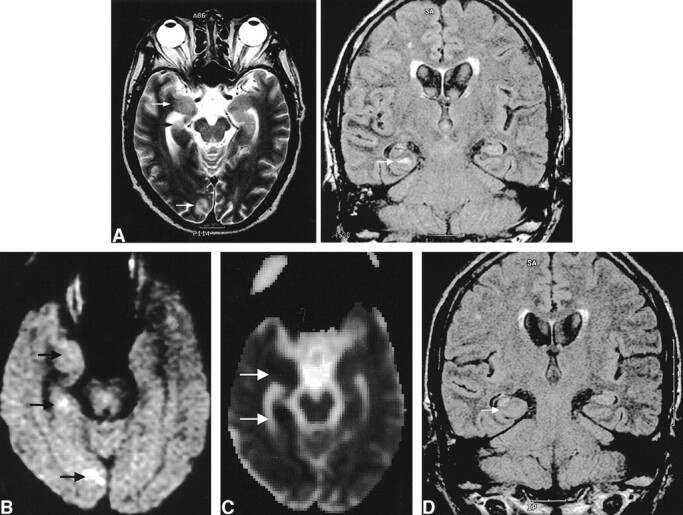
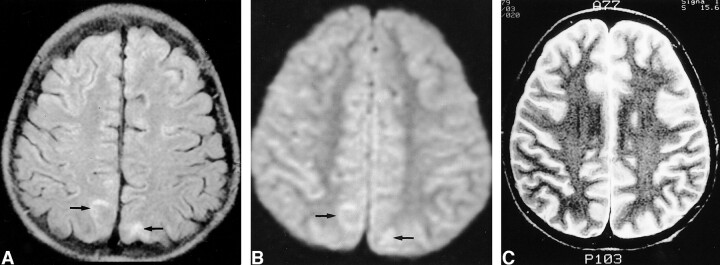
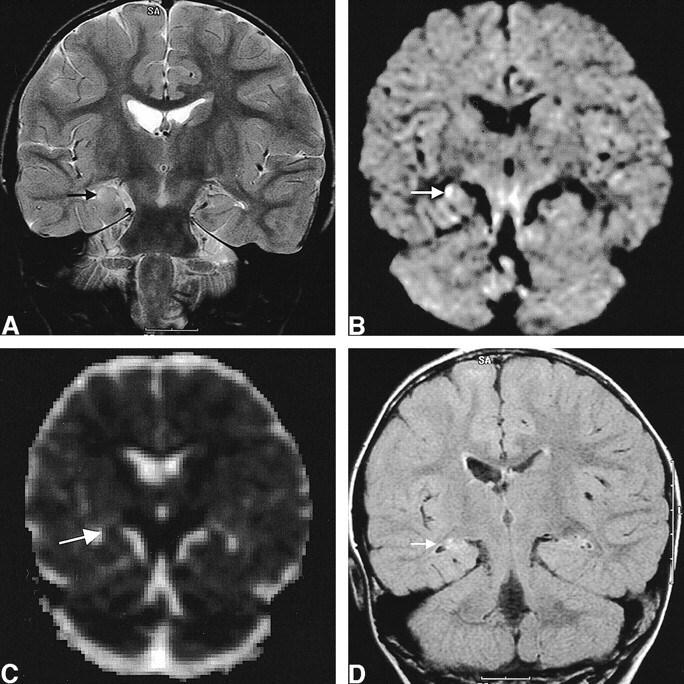
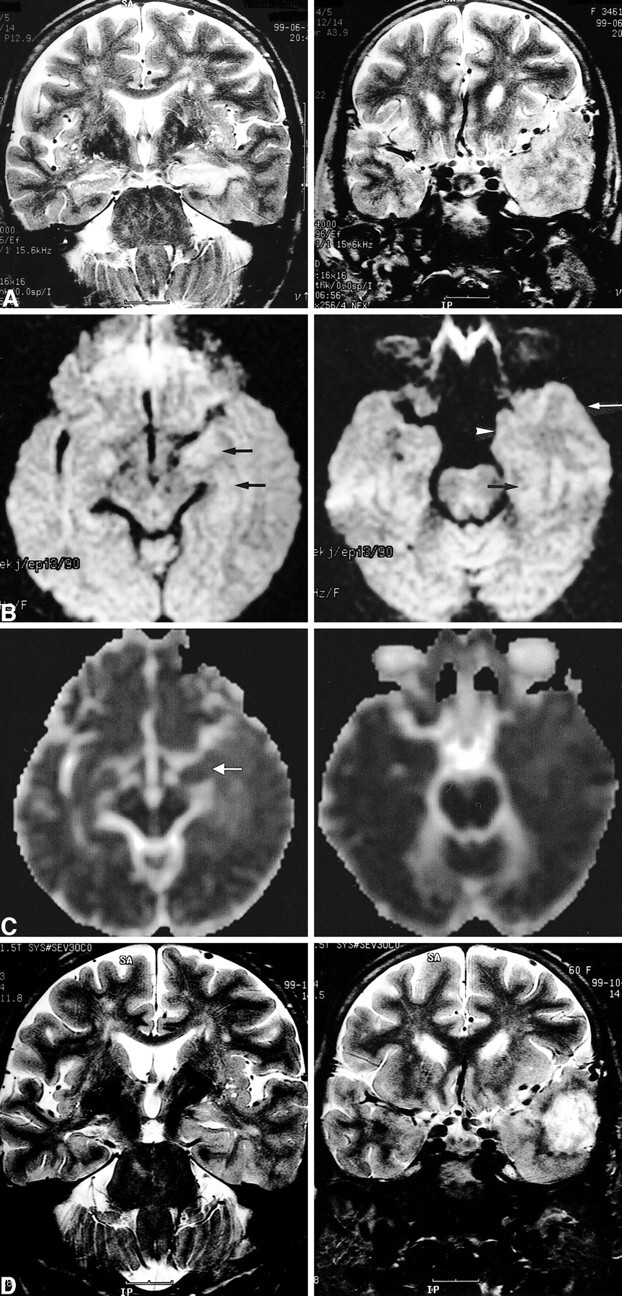
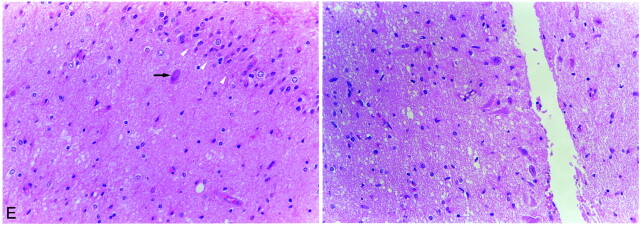
Results: The initial MR images revealed focally increased T2 signal intensity, swelling, and increased volume of the involved cortical gyrus in all eight patients. The lesions were located in the cortical gray matter or subcortical white matter in seven patients and at the right hippocampus in one. T1-weighted images showed decreased signal intensity at exactly the same location (n = 6) and gyral contrast enhancement (n = 4). Diffusion-weighted images revealed increased signal intensity at the same location and focally reduced ADC. The ADC values were reduced by 6% to 28% compared with either the normal structure opposite the lesion or normal control. Follow-up MR imaging revealed the complete resolution of the abnormal T2 signal change and swelling in five patients, whereas resolution of the swelling with residual increased T2 signal intensity at the ipsilateral hippocampus was observed in the other two patients. For one of the two patients, hippocampal sclerosis was diagnosed. For the remaining one patient, newly developed increased T2 signal intensity was shown.

Conclusion: The MR signal changes that occur after generalized tonicoclonic seizure or status epilepticus are transient increase of signal intensity and swelling at the cortical gray matter, subcortical white matter, or hippocampus on periictal T2-weighted and diffusion-weighted images. These findings reflect transient cytotoxic and vasogenic edema induced by seizure. The reversibility and typical location of lesions can help exclude the epileptogenic structural lesions.


Figures

<sc>fig</sc> 1.
fig 1.
Images of a 60-year-old man (patient 5) with complex partial status epilepticus with secondary generalization as the initial presentation of seizure. A, Ictal T2-weighted image (left) shows increased signal intensity with swelling at the subcortical white matter of the right parahippocampal gyrus, uncus, and occipital cortex (arrows). FLAIR image (right) shows the increased signal intensity at the parahippocampal gyrus (arrow) more conspicuously and the atrophy with increased T2 signal intensity of the body of the right hippocampus, indicating ipsilateral mesial temporal sclerosis. B, Diffusion-weighted image shows increased signal intensity at exactly the same areas (arrows). C, ADC map shows a 28% decrease of the mean ADC at the right parahippocampal gyrus and a 27% decrease at the uncus (arrows). D, Follow-up FLAIR image obtained 4 months later shows the resolution of the signal change and swelling at the right parahippocampal gyrus (arrow) and right mesial temporal sclerosis without remarkable interval change of volume and signal intensity.
<sc>fig</sc> 2.
fig 2.
Images of a 12-year-old male patient (patient 2) with generalized tonicoclonic seizure. A, Initial FLAIR image shows increased signal intensity in the cortical gray matter and subcortical white matter in cuneus and precuneus bilaterally (arrows). B, Initial diffusion-weighted image shows mildly increased signal intensity in the corresponding areas (arrows). The decrease of the mean ADC was 8% at the right and 6% at the left on the ADC map (not shown). C, Follow-up T2-weighted image obtained 14 days after the onset of seizure shows complete resolution of the signal change.
<sc>fig</sc> 3.
fig 3.
Images of a 2-year-old female patient (patient 6) with complex partial status epilepticus with secondary generalization. A, Initial T2-weighted image shows increased signal intensity and swelling in the right hippocampus (arrow). B, Initial diffusion-weighted image shows increased signal intensity in the right hippocampus (arrow). C, Corresponding ADC map shows 14% decrease of mean ADC (arrow). D, Follow-up FLAIR image obtained 18 months after the onset of seizure shows the resolution of the swelling and mass effect of the hippocampus (arrow) and increased T2 signal intensity without definite atrophic change of the hippocampus.
<sc>fig</sc> 4.
fig 4.
Images of a 60-year-old woman (patient 7) with simple partial status epilepticus sustained for 5 days. A, Ictal T2-weighted images show extensive swelling and increased signal intensity of the left hippocampus (left) and diffuse swelling with increased signal intensity at the cortical gray matter and subcortical white matter of the adjacent left temporal lobe (right). B, Ictal diffusion-weighted images show increased signal intensity and swelling at the left hippocampus (left, arrows) and at the uncus (right, arrowhead), parahippocampal gyrus (right, black arrow), and inferior temporal gyrus (right, white arrow). C, ADC maps show a 19% decrease of the mean ADC at the left hippocampus (left, arrow) and a 2% to 5% increase of the mean ADC at the subcortical white matter of the uncus, parahippocampal gyrus, and inferior temporal gyrus (right). D, Follow-up T2-weighted images obtained 4 months after the onset of seizure show the resolution of the marked swelling of the left hippocampus and partial resolution of the increased signal intensity of the left hippocampus (left). A tumor was revealed, which was diagnosed as glioblastoma multiforme at the left anterior temporal lobe (right).
<sc>fig</sc> 4.
fig 4.
Continued. E, Light microscopic image of the left hippocampus obtained by amygdalohippocampectomy reveals extensive neuronal loss and gliosis in the CA4 area of the hippocampus (left: arrowheads, granule cell layer of dentate gyrus; arrow, remaining neuron in CA4) and neuronal loss and gliosis in the CA2 area of the hippocampus (right). More neurons are preserved in the CA2 area than in the other areas of the hippocampus (CA4, CA3, and CA1).
<sc>fig</sc> 5.
fig 5.
Images of a 51-year-old woman (patient 8) with generalized tonicoclonic status epilepticus. A, Initial FLAIR images show multiple increased signal intensity and swelling at the cortical gray matter and subcortical white matter of the right inferior frontal gyrus (left, arrowhead), right insular cortex (left, short arrow), left superior, middle, and inferior temporal gyri (right, open arrows), and bilateral hippocampi (long arrows). B, Initial diffusion-weighted images show increased signal intensity at the right inferior frontal gyrus (left, arrows), left temporal lobe (middle), and bilateral hippocampi (right, arrows). C, Follow-up diffusion-weighted images show resolution of the signal changes of the right frontal (left) and left temporal (middle) lobe. The increased signal intensity at the bilateral hippocampi did not resolve (right).
<sc>fig</sc> 6.
fig 6.
Images of a 3-year-old male patient (patient 1) with complex partial status epilepticus show the resolution process of the signal change. A, Initial T2-weighted image shows increased signal intensity in the cortical gray matter of bilateral cingulate gyri (arrows). B, Follow-up T2-weighted image shows partial resolution of the signal intensity 9 days after seizure onset. C, Follow-up T2-weighted image shows complete resolution of the signal intensity 30 days after seizure onset.

References

    1. Cox JE, Mathews VP, Santos CC, Elster AD. Seizure-induced transient hippocampal abnormalities on MR: correlation with positron emission tomography and electroencephalography. AJNR Am J Neuroradiol 1995;16:1736-1738 - PMC - PubMed
    1. Kramer RE, Luders H, Lesser RP, et al. Transient focal abnormalities of neuroimaging studies during focal status epilepticus. Epilepsia 1987;28:528-532 - PubMed
    1. Horowitz SW, Merchut M, Fine M, Azar-Kia B. Complex partial seizure-induced transient MR enhancement. J Comput Assist Tomogr 1992;16:814-816 - PubMed
    1. Henry TR, Drury I, Brunberg JA, Pennell PB, Mckeever PE, Beydoun A. Focal cerebral magnetic resonance changes associated with partial status epilepticus. Epilepsia 1994;35:35-41 - PubMed
    1. Helpern JA, Huang N. Diffusion-weighted imaging in epilepsy. Magn Reson Imaging 1995;13:1227-1231 - PubMed

MeSH terms