. 2001 Jul;21(14):4785-806.
doi: 10.1128/MCB.21.14.4785-4806.2001.

Insulin-responsive compartments containing GLUT4 in 3T3-L1 and CHO cells: regulation by amino acid concentrations

Affiliations

Insulin-responsive compartments containing GLUT4 in 3T3-L1 and CHO cells: regulation by amino acid concentrations

J S Bogan et al. Mol Cell Biol. 2001 Jul.

Abstract

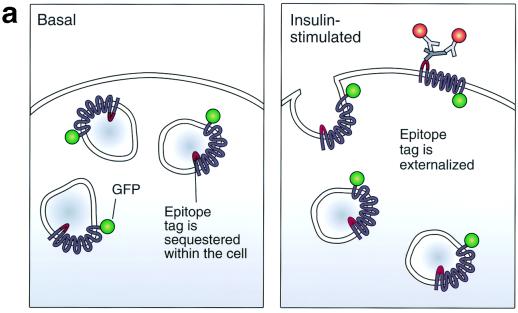
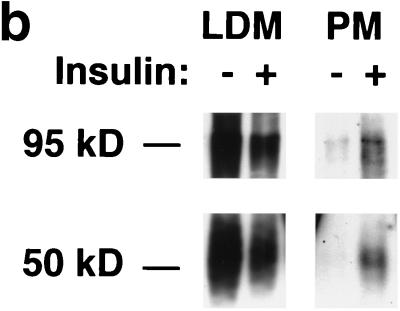
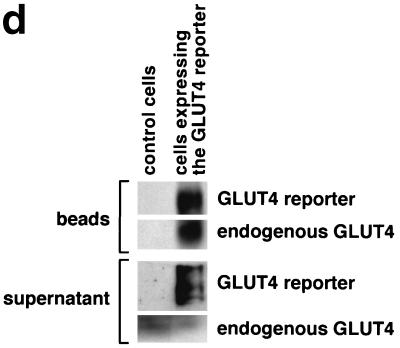
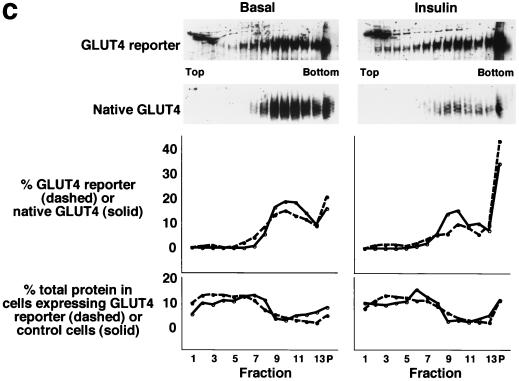
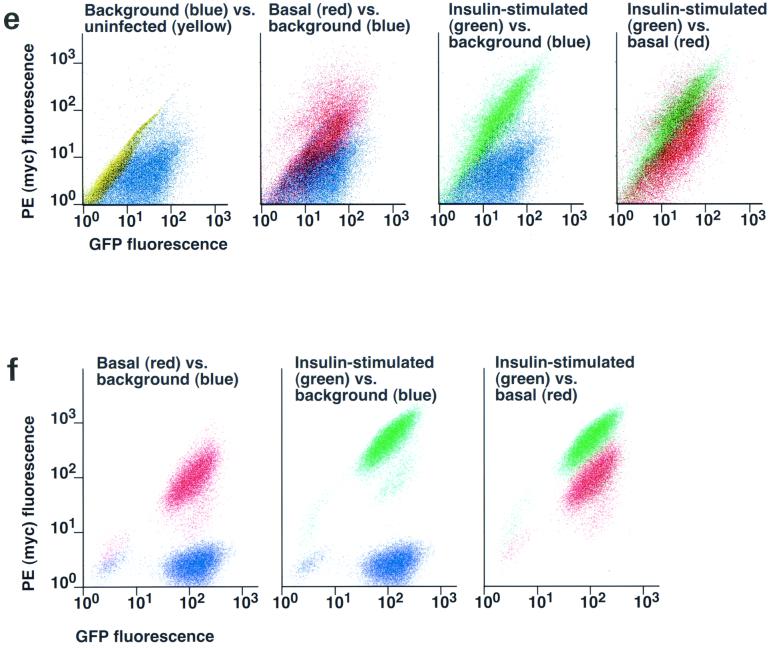
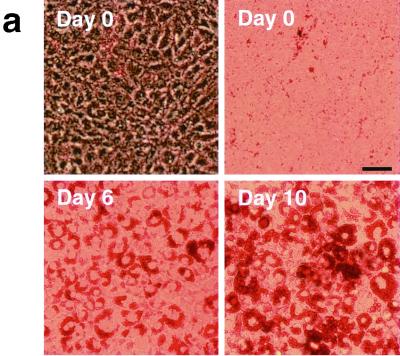
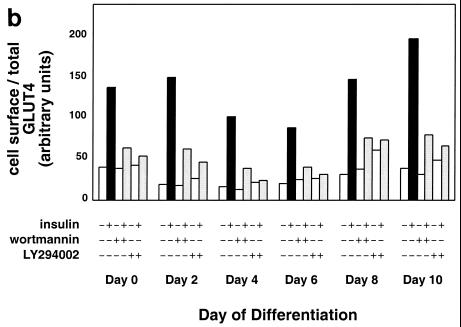
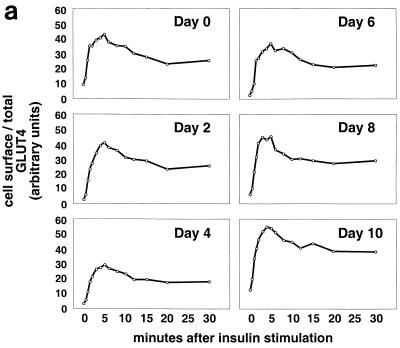
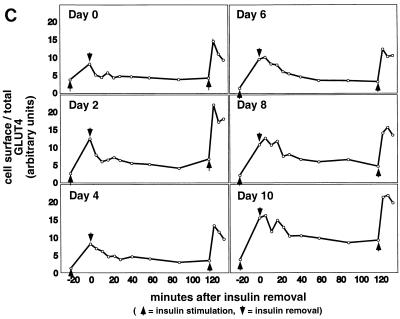
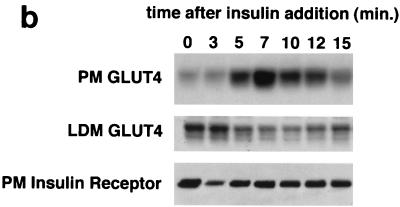
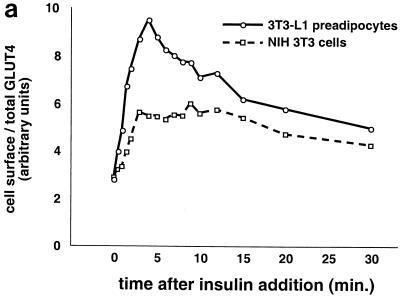
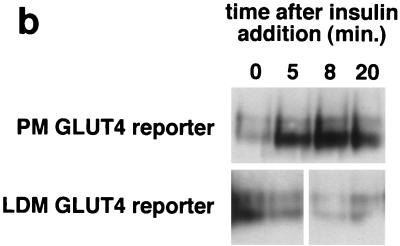
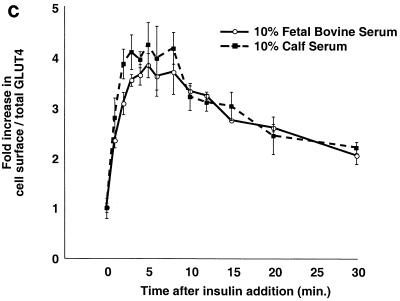
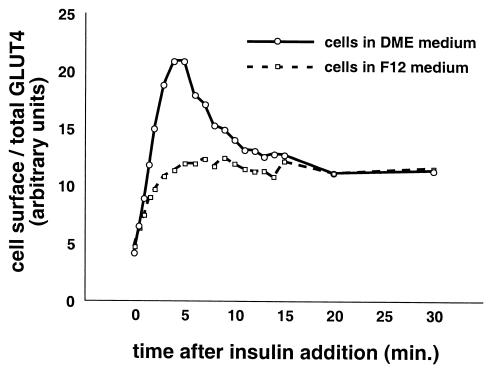
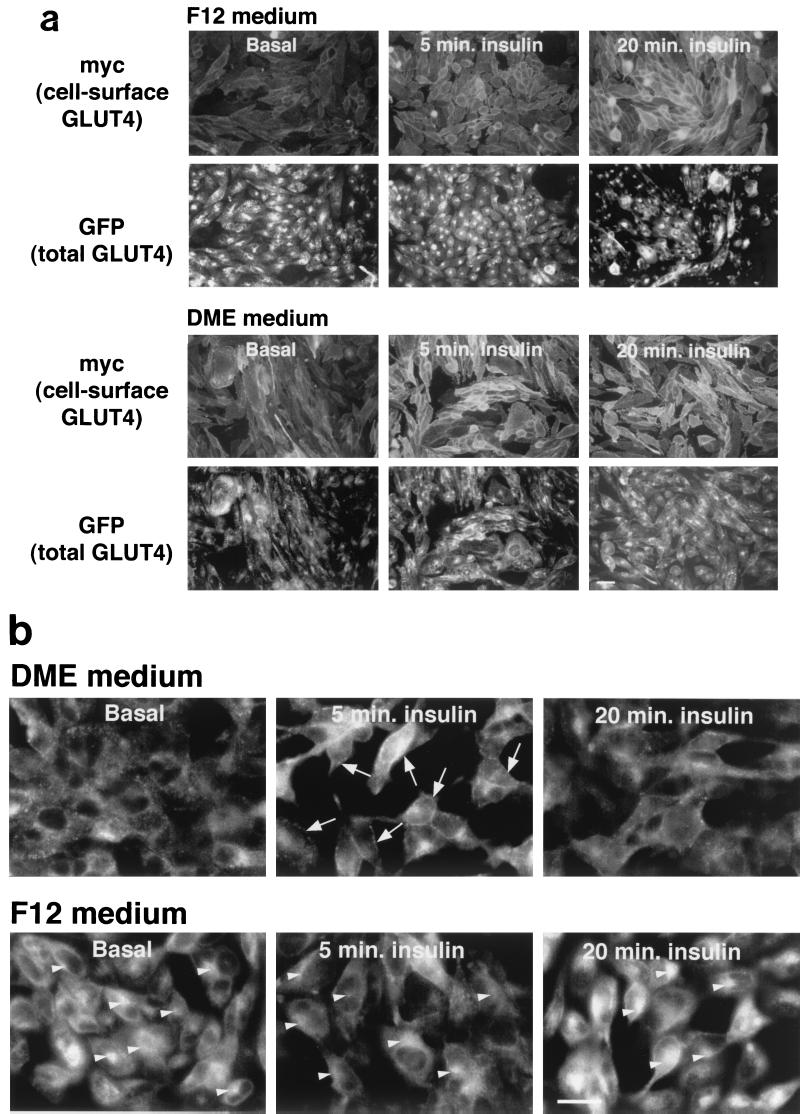
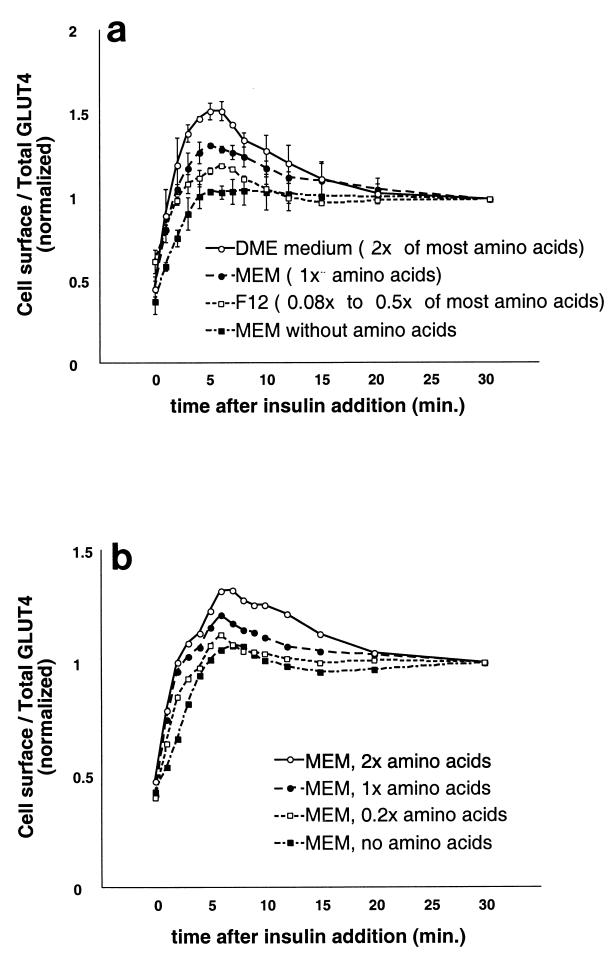
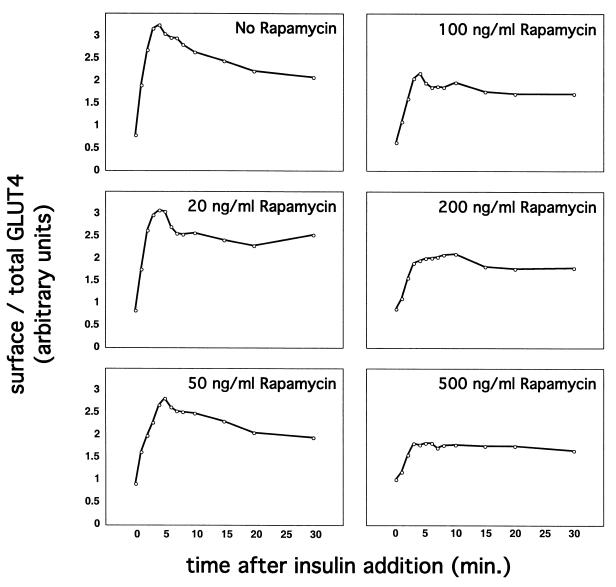
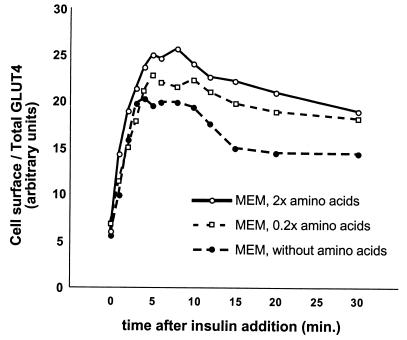
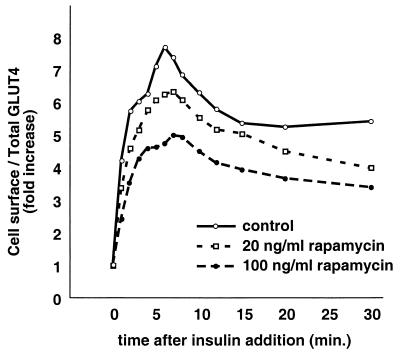
In fat and muscle, insulin stimulates glucose uptake by rapidly mobilizing the GLUT4 glucose transporter from a specialized intracellular compartment to the plasma membrane. We describe a method to quantify the relative proportion of GLUT4 at the plasma membrane, using flow cytometry to measure a ratio of fluorescence intensities corresponding to the cell surface and total amounts of a tagged GLUT4 reporter in individual living cells. Using this assay, we demonstrate that both 3T3-L1 and CHO cells contain intracellular compartments from which GLUT4 is rapidly mobilized by insulin and that the initial magnitude and kinetics of redistribution to the plasma membrane are similar in these two cell types when they are cultured identically. Targeting of GLUT4 to a highly insulin-responsive compartment in CHO cells is modulated by culture conditions. In particular, we find that amino acids regulate distribution of GLUT4 to this kinetically defined compartment through a rapamycin-sensitive pathway. Amino acids also modulate the magnitude of insulin-stimulated translocation in 3T3-L1 adipocytes. Our results indicate a novel link between glucose and amino acid metabolism.


Figures

FIG. 1
FIG. 1
Assay for changes in proportion of GLUT4 at the plasma membrane. A GLUT4 reporter containing Myc epitope tags in the first exofacial loop as well as GFP fused in frame at the carboxy terminus was constructed as described in Materials and Methods. As shown in panel a, this reporter enables measurement of changes in the proportion of GLUT4 at the plasma membrane as changes in the ratio of fluorescence intensities corresponding to cell surface and total amounts of the reporter. Cell surface GLUT4 reporter is detected using an anti-Myc primary antibody and PE-conjugated secondary antibody. Total GLUT4 reporter is proportional to GFP fluorescence. (b) Low-density microsome (LDM) and plasma membrane (PM) fractions were isolated from 3T3-L1 adipocytes expressing the reporter and analyzed by SDS-PAGE and immunoblotting. Equal amounts of protein were loaded in each lane. Immunoblotting was done using an antibody directed against the carboxyl terminus of GLUT4 and demonstrates that both the reporter (95 kDa) and native GLUT4 (50 kDa) are redistributed from the LDM fraction to the PM after acute insulin treatment. The amount of translocation is quantitatively similar. (c) The LDM fractions from basal and insulin-stimulated 3T3-L1 adipocytes expressing the reporter and from control cells were further separated by sedimentation on a 10 to 30% linear sucrose gradient, as described in Materials and Methods. Equal volumes of each gradient fraction were analyzed by to determine total protein and by SDS-PAGE and immunoblotting to detect native GLUT4 (in control cells, using an anti-GLUT4 antibody) and the GLUT4 reporter (using an anti-Myc antibody). As shown in the top panels, the reporter and endogenous GLUT4 cosediment in both basal (left) and insulin-stimulated (right) cells. Densitometry was used to quantify the bands (middle panels), and data are plotted as the percentage of the total reporter or native GLUT4 present in each gradient fraction; these profiles are quite similar. As a control, the percentage of total protein present in each gradient fraction is plotted (lower panels); these profiles are similar to each other and distinct from those of the GLUT4 reporter and endogenous GLUT4. (d) LDM fractions from unstimulated 3T3-L1 adipocytes expressing the reporter and from control cells not expressing the reporter were used in vesicle immunopurification experiments. LDM fractions were incubated with two pooled anti-GFP monoclonal antibodies, followed by protein G-Sepharose beads. After pelleting and washing of the beads, the immunopurified material was eluted in sample buffer and analyzed by SDS-PAGE and immunoblotting with an anti-GLUT4 rabbit polyclonal antibody. As shown in the upper two panels, native GLUT4 is detected in the immunopurified material. The lower panels present a similar immunoblot of the supernatants and demonstrate that even though the immunopurification did not quantitatively remove all of the GLUT4 reporter, the endogenous GLUT4 is depleted, as expected. (e) Flow cytometry is used to quantify the insulin-stimulated change in the proportion of GLUT4 at the plasma membrane of 3T3-L1 adipocytes expressing the reporter protein. Serum-starved cells were treated or not with insulin, chilled, stained for externalized Myc epitope tag, and analyzed by FACS as described in Materials and Methods. PE and GFP fluorescence intensities are plotted on the vertical and horizontal axes, respectively, of the dotplots presented. Note that both scales are logarithmic. Compared to the background fluorescence of cells not expressing the reporter (yellow), cells expressing the reporter (blue) have increased GFP fluorescence (leftmost panel). Among cells expressing the reporter, unstained cells (blue) and basal (stained for cell surface Myc, shown in red) and insulin-stimulated (stained for cell surface Myc, shown in green) populations have progressively increasing PE fluorescence with no change in GFP fluorescence. Control experiments show that the background staining is negligible (not shown). The four panels allow direct comparison of pairs of samples. In this experiment, insulin caused a fourfold increase in the ratio of median fluorescence intensities attributable to externalized Myc epitope and to GFP expression, corresponding to a fourfold increase in the proportion of total GLUT4 present at the cell surface. (f) Flow cytometry was used to measure insulin-stimulated GLUT4 translocation in confluent CHO cells. As in panel e, PE fluorescence (proportional to cell surface GLUT4 reporter) is plotted on the vertical axis and GFP fluorescence (proportional to total GLUT4 reporter) is plotted on the horizontal axis; both scales are logarithmic. Background (unstained) cells expressing the reporter are shown in blue, and basal and insulin-stimulated populations are shown in red and green, respectively. The three panels allow direct comparison between each pair of samples. There is a minor population of unstained cells (blue) within the first decade of each scale; these cells do not express the GLUT4 reporter and conveniently demonstrate that the flow cytometer is properly adjusted to compensate for fluorophore bleedthrough. Compared to 3T3-L1 adipocytes, the background fluorescences (both PE and GFP) account for much less of the total fluorescence intensities in CHO cells, and the signal-noise ratio is correspondingly increased (compare panels e and f). In this experiment, insulin stimulated a 3.5-fold increase in the proportion of total GLUT4 present at the cell surface.
FIG. 1
FIG. 1
Assay for changes in proportion of GLUT4 at the plasma membrane. A GLUT4 reporter containing Myc epitope tags in the first exofacial loop as well as GFP fused in frame at the carboxy terminus was constructed as described in Materials and Methods. As shown in panel a, this reporter enables measurement of changes in the proportion of GLUT4 at the plasma membrane as changes in the ratio of fluorescence intensities corresponding to cell surface and total amounts of the reporter. Cell surface GLUT4 reporter is detected using an anti-Myc primary antibody and PE-conjugated secondary antibody. Total GLUT4 reporter is proportional to GFP fluorescence. (b) Low-density microsome (LDM) and plasma membrane (PM) fractions were isolated from 3T3-L1 adipocytes expressing the reporter and analyzed by SDS-PAGE and immunoblotting. Equal amounts of protein were loaded in each lane. Immunoblotting was done using an antibody directed against the carboxyl terminus of GLUT4 and demonstrates that both the reporter (95 kDa) and native GLUT4 (50 kDa) are redistributed from the LDM fraction to the PM after acute insulin treatment. The amount of translocation is quantitatively similar. (c) The LDM fractions from basal and insulin-stimulated 3T3-L1 adipocytes expressing the reporter and from control cells were further separated by sedimentation on a 10 to 30% linear sucrose gradient, as described in Materials and Methods. Equal volumes of each gradient fraction were analyzed by to determine total protein and by SDS-PAGE and immunoblotting to detect native GLUT4 (in control cells, using an anti-GLUT4 antibody) and the GLUT4 reporter (using an anti-Myc antibody). As shown in the top panels, the reporter and endogenous GLUT4 cosediment in both basal (left) and insulin-stimulated (right) cells. Densitometry was used to quantify the bands (middle panels), and data are plotted as the percentage of the total reporter or native GLUT4 present in each gradient fraction; these profiles are quite similar. As a control, the percentage of total protein present in each gradient fraction is plotted (lower panels); these profiles are similar to each other and distinct from those of the GLUT4 reporter and endogenous GLUT4. (d) LDM fractions from unstimulated 3T3-L1 adipocytes expressing the reporter and from control cells not expressing the reporter were used in vesicle immunopurification experiments. LDM fractions were incubated with two pooled anti-GFP monoclonal antibodies, followed by protein G-Sepharose beads. After pelleting and washing of the beads, the immunopurified material was eluted in sample buffer and analyzed by SDS-PAGE and immunoblotting with an anti-GLUT4 rabbit polyclonal antibody. As shown in the upper two panels, native GLUT4 is detected in the immunopurified material. The lower panels present a similar immunoblot of the supernatants and demonstrate that even though the immunopurification did not quantitatively remove all of the GLUT4 reporter, the endogenous GLUT4 is depleted, as expected. (e) Flow cytometry is used to quantify the insulin-stimulated change in the proportion of GLUT4 at the plasma membrane of 3T3-L1 adipocytes expressing the reporter protein. Serum-starved cells were treated or not with insulin, chilled, stained for externalized Myc epitope tag, and analyzed by FACS as described in Materials and Methods. PE and GFP fluorescence intensities are plotted on the vertical and horizontal axes, respectively, of the dotplots presented. Note that both scales are logarithmic. Compared to the background fluorescence of cells not expressing the reporter (yellow), cells expressing the reporter (blue) have increased GFP fluorescence (leftmost panel). Among cells expressing the reporter, unstained cells (blue) and basal (stained for cell surface Myc, shown in red) and insulin-stimulated (stained for cell surface Myc, shown in green) populations have progressively increasing PE fluorescence with no change in GFP fluorescence. Control experiments show that the background staining is negligible (not shown). The four panels allow direct comparison of pairs of samples. In this experiment, insulin caused a fourfold increase in the ratio of median fluorescence intensities attributable to externalized Myc epitope and to GFP expression, corresponding to a fourfold increase in the proportion of total GLUT4 present at the cell surface. (f) Flow cytometry was used to measure insulin-stimulated GLUT4 translocation in confluent CHO cells. As in panel e, PE fluorescence (proportional to cell surface GLUT4 reporter) is plotted on the vertical axis and GFP fluorescence (proportional to total GLUT4 reporter) is plotted on the horizontal axis; both scales are logarithmic. Background (unstained) cells expressing the reporter are shown in blue, and basal and insulin-stimulated populations are shown in red and green, respectively. The three panels allow direct comparison between each pair of samples. There is a minor population of unstained cells (blue) within the first decade of each scale; these cells do not express the GLUT4 reporter and conveniently demonstrate that the flow cytometer is properly adjusted to compensate for fluorophore bleedthrough. Compared to 3T3-L1 adipocytes, the background fluorescences (both PE and GFP) account for much less of the total fluorescence intensities in CHO cells, and the signal-noise ratio is correspondingly increased (compare panels e and f). In this experiment, insulin stimulated a 3.5-fold increase in the proportion of total GLUT4 present at the cell surface.
FIG. 2
FIG. 2
Adipose differentiation and GLUT4 translocation in 3T3-L1 cells. 3T3-L1 preadipocytes were infected with a retrovirus containing the GLUT4 reporter, and flow sorting was used to isolate a population of cells falling within a narrow range of GFP fluorescence intensities. These cells were expanded and used in experiments; because the retrovirus integrates into the genome, the population is stable. These cells undergo normal 3T3-L1 adipose differentiation, as demonstrated by staining lipid with Oil red O. (a) Phase-contrast (upper left) and bright-field (upper right and lower left and right) microscopy of cells at the indicated days of differentiation is shown. Scale bar, 50 μm. (b) Confluent 3T3-L1 preadipocytes (day 0) or 3T3-L1 cells that had undergone differentiation for various lengths of time were stimulated or not with insulin (160 nM, 10 min), and changes in the proportion of GLUT4 reporter present at the cell surface were measured using flow cytometry as described in the text. Some samples were treated with either 100 nM wortmannin (42) or 50 μM LY294002 (8, 13) for 40 min prior to insulin addition, as noted. The amount of the reporter within each cell varies during 3T3-L1 differentiation and is increased approximately threefold on days 2 and 4 (not shown). We attribute this to increased activity of the retroviral promoter as the cells undergo clonal expansion at the onset of adipocyte differentiation, especially since we also observed increased expression of the reporter in preconfluent, dividing cells (91). Because the assay measures changes in the ratio of cell surface to total GLUT4 rather than in the absolute amount of cell surface GLUT4, the data presented are internally controlled for this variation, and data from different days of differentiation can be meaningfully compared. The numbering on the vertical scale indicates a relative measure of GLUT4 at the cell surface, and these arbitrary units cannot be compared in absolute terms to those in other figures. In all instances, insulin stimulates GLUT4 exocytosis, and this effect is blocked by either of the two phosphatidylinositol-3-kinase inhibitors.
FIG. 2
FIG. 2
Adipose differentiation and GLUT4 translocation in 3T3-L1 cells. 3T3-L1 preadipocytes were infected with a retrovirus containing the GLUT4 reporter, and flow sorting was used to isolate a population of cells falling within a narrow range of GFP fluorescence intensities. These cells were expanded and used in experiments; because the retrovirus integrates into the genome, the population is stable. These cells undergo normal 3T3-L1 adipose differentiation, as demonstrated by staining lipid with Oil red O. (a) Phase-contrast (upper left) and bright-field (upper right and lower left and right) microscopy of cells at the indicated days of differentiation is shown. Scale bar, 50 μm. (b) Confluent 3T3-L1 preadipocytes (day 0) or 3T3-L1 cells that had undergone differentiation for various lengths of time were stimulated or not with insulin (160 nM, 10 min), and changes in the proportion of GLUT4 reporter present at the cell surface were measured using flow cytometry as described in the text. Some samples were treated with either 100 nM wortmannin (42) or 50 μM LY294002 (8, 13) for 40 min prior to insulin addition, as noted. The amount of the reporter within each cell varies during 3T3-L1 differentiation and is increased approximately threefold on days 2 and 4 (not shown). We attribute this to increased activity of the retroviral promoter as the cells undergo clonal expansion at the onset of adipocyte differentiation, especially since we also observed increased expression of the reporter in preconfluent, dividing cells (91). Because the assay measures changes in the ratio of cell surface to total GLUT4 rather than in the absolute amount of cell surface GLUT4, the data presented are internally controlled for this variation, and data from different days of differentiation can be meaningfully compared. The numbering on the vertical scale indicates a relative measure of GLUT4 at the cell surface, and these arbitrary units cannot be compared in absolute terms to those in other figures. In all instances, insulin stimulates GLUT4 exocytosis, and this effect is blocked by either of the two phosphatidylinositol-3-kinase inhibitors.
FIG. 3
FIG. 3
Kinetics of GLUT4 trafficking in 3T3-L1 cells. (a) Confluent 3T3-L1 preadipocytes (day 0) or 3T3-L1 cells at various stages of adipocyte differentiation (as indicated) were treated with insulin for various lengths of time, and changes in the proportion of GLUT4 reporter present at the cell surface were analyzed. Data are plotted for basal cells and for cells treated with 80 nM insulin for 0.5, 1, 1.5, 2, 3, 4, 5, 6, 8, 10, 12, 15, 20, or 30 min. Membrane trafficking was stopped by washing with cold PBS, cells were stained at 4°C for externalized Myc epitope tag using a PE-conjugated secondary antibody, and PE and GFP fluorescence intensities were measured using flow cytometry as described in the text. Regardless of the state of differentiation, insulin causes a rapid externalization of GLUT4 that peaks 4 to 5 min after insulin addition. Subsequently, there is a net internalization, so that a steady state in the presence of insulin is reached 20 min after insulin addition. The numbering on the vertical scale indicates a relative measure of GLUT4 at the cell surface, and these arbitrary units cannot be compared in absolute terms to those in other figures. (b) Insulin-stimulated translocation of endogenous GLUT4 to the plasma membrane of 3T3-L1 adipocytes was analyzed by subcellular fractionation. Cells were starved overnight and then stimulated with 480 nM insulin (added from a prewarmed, 3× stock) for various amounts of time. Cells were transferred to 4°C, washed with cold PBS, and fractionated as described in Materials and Methods. Plasma membrane (PM) and low-density microsomal (LDM) fractions were analyzed by immunoblotting. Equal amounts of protein were loaded in each lane. GLUT4 translocates to the plasma membrane in a biphasic pattern, with a peak at 7 min after insulin addition, followed by a subsequent decrease. A reciprocal pattern is observed in the LDM fraction. As a control, the PM immunoblot was reprobed with an anti-insulin receptor (β-subunit) antibody, which demonstrates similar amounts of insulin receptor at the plasma membrane at all time points. The experiment was performed twice, with similar results each time. (c) 3T3-L1 preadipocytes (day 0) or cells at various times during adipocyte differentiation were stimulated with 80 nM insulin for 20 min, then placed at 4°C, and washed with an acidic buffer to remove insulin. Cells were rewarmed in serum-free medium to allow GLUT4 reinternalization for 6, 12, 18, 24, 30, 40, 60, 90, or 120 min; some cells that had been rewarmed for 120 min were restimulated with 80 nM insulin for 5, 10, or 15 min. Cells were stained for cell surface Myc epitope and analyzed by flow cytometry as described in the text. In all instances, the GLUT4 reporter was reinternalized after removal of insulin and recycles upon readdition of insulin.
FIG. 3
FIG. 3
Kinetics of GLUT4 trafficking in 3T3-L1 cells. (a) Confluent 3T3-L1 preadipocytes (day 0) or 3T3-L1 cells at various stages of adipocyte differentiation (as indicated) were treated with insulin for various lengths of time, and changes in the proportion of GLUT4 reporter present at the cell surface were analyzed. Data are plotted for basal cells and for cells treated with 80 nM insulin for 0.5, 1, 1.5, 2, 3, 4, 5, 6, 8, 10, 12, 15, 20, or 30 min. Membrane trafficking was stopped by washing with cold PBS, cells were stained at 4°C for externalized Myc epitope tag using a PE-conjugated secondary antibody, and PE and GFP fluorescence intensities were measured using flow cytometry as described in the text. Regardless of the state of differentiation, insulin causes a rapid externalization of GLUT4 that peaks 4 to 5 min after insulin addition. Subsequently, there is a net internalization, so that a steady state in the presence of insulin is reached 20 min after insulin addition. The numbering on the vertical scale indicates a relative measure of GLUT4 at the cell surface, and these arbitrary units cannot be compared in absolute terms to those in other figures. (b) Insulin-stimulated translocation of endogenous GLUT4 to the plasma membrane of 3T3-L1 adipocytes was analyzed by subcellular fractionation. Cells were starved overnight and then stimulated with 480 nM insulin (added from a prewarmed, 3× stock) for various amounts of time. Cells were transferred to 4°C, washed with cold PBS, and fractionated as described in Materials and Methods. Plasma membrane (PM) and low-density microsomal (LDM) fractions were analyzed by immunoblotting. Equal amounts of protein were loaded in each lane. GLUT4 translocates to the plasma membrane in a biphasic pattern, with a peak at 7 min after insulin addition, followed by a subsequent decrease. A reciprocal pattern is observed in the LDM fraction. As a control, the PM immunoblot was reprobed with an anti-insulin receptor (β-subunit) antibody, which demonstrates similar amounts of insulin receptor at the plasma membrane at all time points. The experiment was performed twice, with similar results each time. (c) 3T3-L1 preadipocytes (day 0) or cells at various times during adipocyte differentiation were stimulated with 80 nM insulin for 20 min, then placed at 4°C, and washed with an acidic buffer to remove insulin. Cells were rewarmed in serum-free medium to allow GLUT4 reinternalization for 6, 12, 18, 24, 30, 40, 60, 90, or 120 min; some cells that had been rewarmed for 120 min were restimulated with 80 nM insulin for 5, 10, or 15 min. Cells were stained for cell surface Myc epitope and analyzed by flow cytometry as described in the text. In all instances, the GLUT4 reporter was reinternalized after removal of insulin and recycles upon readdition of insulin.
FIG. 4
FIG. 4
Kinetics of GLUT4 trafficking in 3T3-L1 preadipocytes and NIH 3T3 cells. (a) Confluent 3T3-L1 preadipocytes and NIH 3T3 cells expressing similar amounts of the reporter were treated with 160 nM insulin for various lengths of time, chilled, and analyzed by FACS to measure changes in the proportion of GLUT4 reporter present at the cell surface. Insulin caused a much more marked redistribution of GLUT4 to the plasma membrane of 3T3-L1 preadipocytes than of NIH 3T3 cells. (b) Translocation of the GLUT4 reporter in 3T3-L1 preadipocytes was assayed by subcellular fractionation and immunoblotting. After serum starvation, cells were stimulated with 480 nM insulin (added from a prewarmed 3× stock) for various amounts of time, then washed with cold PBS++, and fractionated as described in Materials and Methods. Equal amounts of protein were loaded in each lane. Insulin caused an increase in the amount of GLUT4 reporter in the plasma membrane (PM) fraction, with a peak response at 8 min after insulin addition and a subsequent decrease at 20 min. A reciprocal pattern is apparent in the low-density microsomal (LDM) fraction. The experiment was performed twice, with similar results each time. (c) Confluent 3T3-L1 preadipocytes were cultured for 3 days in either 10% fetal bovine serum or 10% calf serum. Cells were then starved, stimulated with 160 nM insulin for various amounts of time, and analyzed by flow cytometry. Samples were measured in duplicate (control samples were in triplicate or quadruplicate). Insulin caused similar increases in the fraction of GLUT4 reporter at the plasma membrane under both conditions. The experiment was done twice, with similar results each time.
FIG. 4
FIG. 4
Kinetics of GLUT4 trafficking in 3T3-L1 preadipocytes and NIH 3T3 cells. (a) Confluent 3T3-L1 preadipocytes and NIH 3T3 cells expressing similar amounts of the reporter were treated with 160 nM insulin for various lengths of time, chilled, and analyzed by FACS to measure changes in the proportion of GLUT4 reporter present at the cell surface. Insulin caused a much more marked redistribution of GLUT4 to the plasma membrane of 3T3-L1 preadipocytes than of NIH 3T3 cells. (b) Translocation of the GLUT4 reporter in 3T3-L1 preadipocytes was assayed by subcellular fractionation and immunoblotting. After serum starvation, cells were stimulated with 480 nM insulin (added from a prewarmed 3× stock) for various amounts of time, then washed with cold PBS++, and fractionated as described in Materials and Methods. Equal amounts of protein were loaded in each lane. Insulin caused an increase in the amount of GLUT4 reporter in the plasma membrane (PM) fraction, with a peak response at 8 min after insulin addition and a subsequent decrease at 20 min. A reciprocal pattern is apparent in the low-density microsomal (LDM) fraction. The experiment was performed twice, with similar results each time. (c) Confluent 3T3-L1 preadipocytes were cultured for 3 days in either 10% fetal bovine serum or 10% calf serum. Cells were then starved, stimulated with 160 nM insulin for various amounts of time, and analyzed by flow cytometry. Samples were measured in duplicate (control samples were in triplicate or quadruplicate). Insulin caused similar increases in the fraction of GLUT4 reporter at the plasma membrane under both conditions. The experiment was done twice, with similar results each time.
FIG. 5
FIG. 5
Culture conditions modulate the kinetics of insulin-stimulated GLUT4 translocation in CHO cells. Two days before the experiment, confluent CHO cells were placed in DMEM identical to that used for 3T3-L1 adipocytes or left in F12 culture medium. Cells were starved overnight before the experiment. On the day of the experiment, cells were stimulated with 80 nM insulin for 0, 0.5, 1, 1.5, 2, 3, 4, 5, 6, 7, 8, 9, 10, 11, 12, 13, 14, 15, 20, or 30 min, then transferred to 4°C, and washed with cold PBS. Staining and flow cytometry were done as described in the text. For cells cultured in DMEM, insulin stimulated a rapid increase in GLUT4 reporter present at the cell surface, peaking at 4 to 5 min after insulin addition. Subsequently, the proportion of GLUT4 on the plasma membrane decreases, and a steady state in the presence of insulin is reached 20 min after insulin addition. In contrast, cells cultured in F12 medium externalized GLUT4 with monophasic kinetics, characterized by no overshoot of the final steady-state response in the presence of insulin. Both the initial and final proportions of GLUT4 at the cell surface are essentially unaffected by the culture conditions, despite the marked effect on intermediate time points. For cells cultured in DMEM, the peak response is a 5.5-fold increase in the proportion of GLUT4 at the cell surface compared to the basal state. The kinetics and the amplitude of the peak response are similar in CHO cells cultured in DMEM and in 3T3-L1 cells (compare to Fig. 3a, 4a, and 4c).
FIG. 6
FIG. 6
Culture conditions modulate the subcellular distribution of GLUT4 in CHO cells. CHO cells expressing the GLUT4 reporter were plated on coverslips, allowed to reach confluence, and then treated as described in the legend to Fig. 5. Two days before microscopy, cells were changed to DMEM or continued in F12 culture medium. On the day of microscopy, cells were serum starved for 3 h and then stimulated with 160 nM insulin for the times indicated. (a) Cells were chilled and stained without fixation or permeablization to detect externalized Myc epitope tag. A red (Alexa594-conjugated) secondary antibody was used, and the images are shown in the first (F12) and third (DMEM) rows. GFP was used to detect the total cellular GLUT4 reporter, and images are shown in green in the second (F12) and fourth (DMEM) rows. Cells cultured in F12 medium have the greatest amount of GLUT4 at the cell surface at 20 min, whereas those cultured in DMEM have more at the cell surface at 5 min. Scale bar, 10 μm. (b) The subcellular distribution of the GLUT4 reporter is more closely examined. These cells were fixed, permeablized, and stained with anti-Myc antibody and a FITC-conjugated secondary antibody in order to increase the total green fluorescent signal, which is then due to the combination of GFP and FITC. In cells cultured in F12, there is prominent staining of the GLUT4 reporter in the perinuclear region; this does not change significantly with short-term insulin treatment (bottom panels, arrowheads). In contrast, the GLUT4 reporter is absent from the perinuclear region in unstimulated cells cultured in DMEM and is present more prominently in punctate, peripheral structures (top left panel). Insulin treatment for 5 min results in a dramatic accumulation of GLUT4 at the plasma membrane in the cells cultured in DMEM (top center panel, arrows). In contrast, cells cultured in F12 medium have much less plasma membrane GLUT4 after 5 min of insulin treatment (bottom center panel). By 20 min after insulin addition, plasma membrane GLUT4 is similar in cells cultured in the two culture media (top right and bottom right panels) and is less prominent than at 5 min in the cells cultured in DMEM (compare to top center panel). The changes observed at the plasma membrane by microscopy correlate well with those quantified by flow cytometry (Fig. 5). Additionally, microscopy demonstrates that when the cells are cultured in DMEM rather than F12 medium, GLUT4 is distributed away from the perinuclear region and into punctate structures in the periphery. Scale bar, 10 μm.
FIG. 7
FIG. 7
Amino acid concentrations regulate the amount of rapidly insulin-mobilized GLUT4 in CHO cells. (a) CHO cells expressing the reporter were cultured in the indicated media for 36 h and serum starved during the last 12 h of this period. Cells were stimulated with 160 nM insulin for various amounts of time, then chilled, stained for externalized Myc epitope tag, and analyzed by FACS as described in the text to determine the relative proportion of GLUT4 at the cell surface in each sample. Compared to the amino acid concentrations in standard MEM (defined as 1× amino acids), concentrations of most amino acids in DMEM are twofold higher, and concentrations of most amino acids in F12 are only 0.08 to 0.5 times as high (depending on the particular amino acid; see Materials and Methods). All media contained 2 mM glutamine. The degree to which insulin stimulates a transient overshoot of the final, steady-state proportion of GLUT4 at the plasma membrane correlates well with the concentrations of essential amino acids in the various media. The data shown are from two separate experiments (mean ± standard deviation) and are normalized to the steady-state response in the presence of insulin (30-min time point). (b) A similar experiment was performed with cells cultured in MEM containing various concentrations of essential amino acids except for glutamine, which was held constant (see text). Higher amino acid concentrations cause a greater overshoot of the final, steady-state fraction of GLUT4 at the plasma membrane after insulin addition.
FIG. 8
FIG. 8
Rapamycin treatment diminishes the amount of rapidly insulin-mobilized GLUT4 in CHO cells. CHO cells expressing the GLUT4 reporter were cultured in DMEM, treated with the indicated concentrations of rapamycin for 36 h, and serum starved during the last 12 h of this period. Cells were stimulated with 160 nM insulin for the indicated times, then chilled, stained for externalized Myc epitope, and subjected to flow cytometry to determine the relative proportion of GLUT4 at the cell surface in each sample. Increasing concentrations of rapamycin caused a progressive diminution of the first phase of GLUT4 externalization (i.e., the overshoot before the steady-state response). Simultaneously, the proportion of GLUT4 at the cell surface in the basal state increased slightly but progressively with increasing rapamycin concentration. Together with the data presented in Fig. 7, these data show that amino acid abundance regulates the amount of rapidly insulin-translocated GLUT4 in CHO cells through a rapamycin-sensitive mechanism.
FIG. 9
FIG. 9
Amino acid sufficiency modulates insulin-stimulated GLUT4 translocation in 3T3-L1 adipocytes. 3T3-L1 adipocytes expressing the GLUT4 reporter were cultured in MEM with the indicated concentrations of amino acids for 36 h and serum starved during the last 12 h. Cells were stimulated with 160 nM insulin for the indicated times, then chilled, stained for externalized Myc epitope tag, and analyzed by flow cytometry to determine the relative proportion of GLUT4 at the cell surface in each sample. MEM with 2× amino acids approximates the amino acid concentrations found in DMEM (see Materials and Methods). Culture of the cells in media with poor amino acid availability results in reduced translocation of GLUT4 to the cell surface after insulin stimulation.
FIG. 10
FIG. 10
Rapamycin treatment diminishes insulin-stimulated GLUT4 translocation in 3T3-L1 adipocytes. 3T3-L1 adipocytes expressing the GLUT4 reporter were cultured in DMEM with the indicated concentrations of rapamycin for 36 h and starved for the final 12 h of this period. Cells were then stimulated with 160 nM insulin for the indicated amounts of time, chilled, stained to detect externalized Myc epitope, and subjected to FACS to determine the relative proportion of GLUT4 at the cell surface in each sample. In the presence of increasing concentrations of rapamycin, GLUT4 was translocated to progressively fewer degrees by insulin stimulation.

References

    1. Aledo J C, Lavoie L, Volchuk A, Keller S R, Klip A, Hundal H S. Identification and characterization of two distinct intracellular GLUT4 pools in rat skeletal muscle: evidence for an endosomal and an insulin-sensitive GLUT4 compartment. Biochem J. 1997;325:727–732. - PMC - PubMed
    1. Al-Hasani H, Yver D R, Cushman S W. Overexpression of the glucose transporter GLUT4 in adipose cells interferes with insulin-stimulated translocation. FEBS Lett. 1999;460:338–342. - PubMed
    1. Araki S, Yang J, Hashiramoto M, Tamori Y, Kasuga M, Holman G D. Subcellular trafficking kinetics of GLUT4 mutated at the N- and C-terminal. Biochem J. 1996;315:153–159. - PMC - PubMed
    1. Asano T, Takata K, Katagiri H, Tsukuda K, Lin J L, Ishihara H, Inukai K, Hirano H, Yazaki Y, Oka Y. Domains responsible for the differential targeting of glucose transporter isoforms. J Biol Chem. 1992;267:19636–19641. - PubMed
    1. Baker B W, Boettiger D, Spooncer E, Norton J D. Efficient retroviral-mediated gene transfer into human B lymphoblastoid cells expressing mouse ecotropic viral receptor. Nucleic Acids Res. 1992;20:5234. - PMC - PubMed

Publication types