. 2001 Jun 19;98(13):7487-91.
doi: 10.1073/pnas.131202798.

Gamma -secretase inhibitors repress thymocyte development

Affiliations

Gamma -secretase inhibitors repress thymocyte development

B K Hadland et al. Proc Natl Acad Sci U S A. .

Abstract

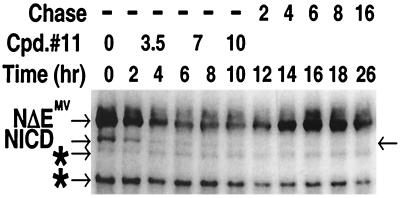
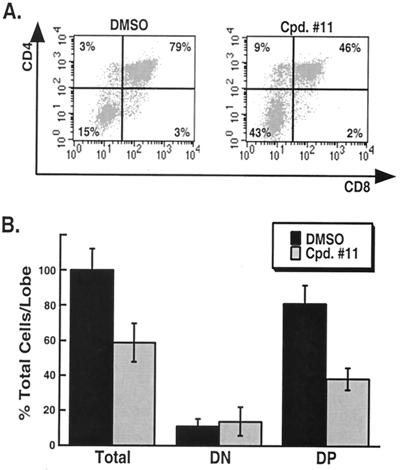
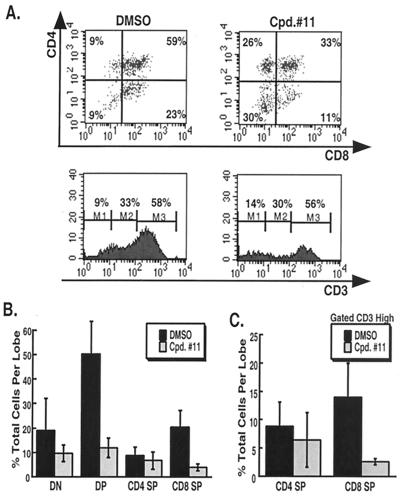
A major therapeutic target in the search for a cure to the devastating Alzheimer's disease is gamma-secretase. This activity resides in a multiprotein enzyme complex responsible for the generation of Abeta42 peptides, precipitates of which are thought to cause the disease. Gamma-secretase is also a critical component of the Notch signal transduction pathway; Notch signals regulate development and differentiation of adult self-renewing cells. This has led to the hypothesis that therapeutic inhibition of gamma-secretase may interfere with Notch-related processes in adults, most alarmingly in hematopoiesis. Here, we show that application of gamma-secretase inhibitors to fetal thymus organ cultures interferes with T cell development in a manner consistent with loss or reduction of Notch1 function. Progression from an immature CD4-/CD8- state to an intermediate CD4+/CD8+ double-positive state was repressed. Furthermore, treatment beginning later at the double-positive stage specifically inhibited CD8+ single-positive maturation but did not affect CD4+ single-positive cells. These results demonstrate that pharmacological gamma-secretase inhibition recapitulates Notch1 loss in a vertebrate tissue and present a system in which rapid evaluation of gamma-secretase-targeted pharmaceuticals for their ability to inhibit Notch activity can be performed in a relevant context.


Figures

Figure 1
Figure 1
Inhibition of Notch1 cleavage by the γ-secretase inhibitor, Cpd. 11. 293 cells were transfected with a ligand-independent Notch1 construct containing Notch1 with the extracellular portion deleted (NΔEMV, precursor, arrow). Cells were treated with 50 μM fresh inhibitor at 0, 3.5, 7, and 10 h to reach maximal inhibition of the cleavage product NICD (arrow). Samples were taken for analysis at 2-h intervals during this treatment period and also at times 2, 4, 6, 8, and 16 h (chase period) after the final treatment. NICD levels remain low even after the 16-h chase period, suggesting Cpd. 11 activity remains for at least 16 h. Asterisk denotes degradation products of Notch1 with no or minimal signaling activity (9).
Figure 2
Figure 2
Continuous treatment of FTOC with the γ-secretase inhibitor Cpd. 11 results in reduced total thymocyte cellularity, specifically affecting cellularity of CD4+CD8+ DP cells. Thymic lobes removed from 15.5-dpc C57BL/6 fetuses were cultured in the presence of Cpd. 11 (50 μM) or DMSO, added fresh every 12 h for 3 days. (A) FACS analysis of CD4 and CD8 expression from a representative sample, showing that relative percentages of the DP population were reduced after Cpd. 11 treatment in FTOC relative to DMSO treatment, whereas the relative percentages of DN cells were increased. (B) Total number of cells recovered per thymic lobe were reduced after 3-day treatment with Cpd. 11 in FTOC, relative to carrier, DMSO, alone (P < 0.01, Student's t test). Total cell numbers in DP populations also were reduced in Cpd. 11-treated samples relative to controls (P < 0.01, Student's t test). Although relative percentages of DN cells by FACS were increased, there was no significant difference in the total DN cells recovered per thymic lobe (P > 0.3, Student's t test). Total cells recovered per lobe varied from experiment to experiment from an average of 5.4 × 10⁴ to 17 × 104 in DMSO samples, reflecting natural variation depending on exact age of thymocyte extraction. Thus, for each separate experiment, values for individual samples first were standardized relative to the average cellularity in control DMSO-treated samples for that experiment and then pooled for statistical analysis. Values for each class (DP, DN, total) are shown as a percentage of average total cells per lobe in DMSO-treated samples. Bars = SD of at least 10 total samples per treatment, from four independent experiments.
Figure 3
Figure 3
Late treatment with the γ-secretase inhibitor Cpd. 11 in FTOC after progression of most thymocytes to the DP stage results in an inhibition of CD8 SP production without affecting CD4 SP progression. Thymic lobes removed from 15.5-dpc C57BL/6 fetuses were cultured for 3 days with no treatment followed by 3–4 days in the presence of Cpd. 11 (50 μM) or DMSO, added fresh every 12 h. (A) FACS analysis of CD4 and CD8 expression from a representative sample demonstrates a reduction in the percentage of CD8 SP thymocytes from FTOC after Cpd. 11 treatment relative to carrier (DMSO) treatment. Relative CD4 percentages, however, were increased for Cpd. 11 treatment. (B) Examination of total cell numbers recovered shows that CD8 SP and DP populations were largely reduced in Cpd. 11 samples relative to controls (P < 0.01 in both cases, Student's t test), whereas total DN and CD4 cell numbers were not significantly different from controls (P > 0.1 and P > 0.3, respectively, Student's t test). (C) When the CD3 high population (mature thymocytes, M3 in A) was gated, the same affect on CD8+ SP cell numbers was seen (P < 0.01, Student's t test). Values were derived as in Fig. 2, and bars = SD of six samples per treatment, from two independent experiments. Several additional experiments carried out under the same conditions resulted in a similar distribution of cell populations, although total cell numbers were not determined.

References

    1. Artavanis-Tsakonas S, Rand M D, Lake R J. Science. 1999;284:770–776. - PubMed
    1. Milner L A, Bigas A. Blood. 1999;93:2431–2448. - PubMed
    1. Deftos M L, Bevan M J. Curr Opin Immunol. 2000;12:166–172. - PubMed
    1. Mumm J S, Schroeter E H, Saxena M T, Griesemer A, Tian X, Pan D J, Ray W J, Kopan R. Mol Cell. 2000;5:197–206. - PubMed
    1. Struhl G, Greenwald I. Nature (London) 1999;398:522–525. - PubMed

Publication types

MeSH terms