. 2001 Jul;10(7):1331-42.
doi: 10.1110/ps.44101.

The energetic cost of induced fit catalysis: Crystal structures of trypsinogen mutants with enhanced activity and inhibitor affinity

Affiliations

The energetic cost of induced fit catalysis: Crystal structures of trypsinogen mutants with enhanced activity and inhibitor affinity

A Pasternak et al. Protein Sci. 2001 Jul.

Abstract

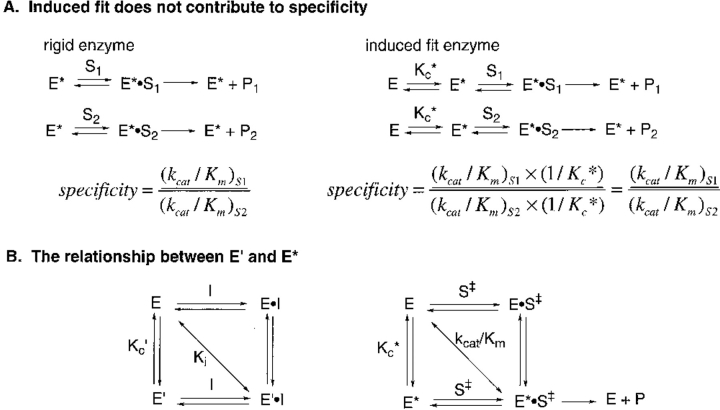
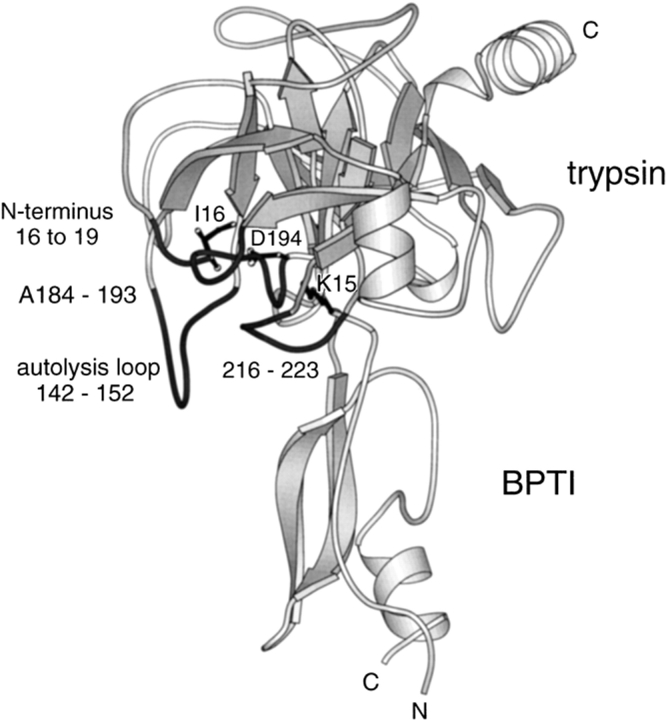
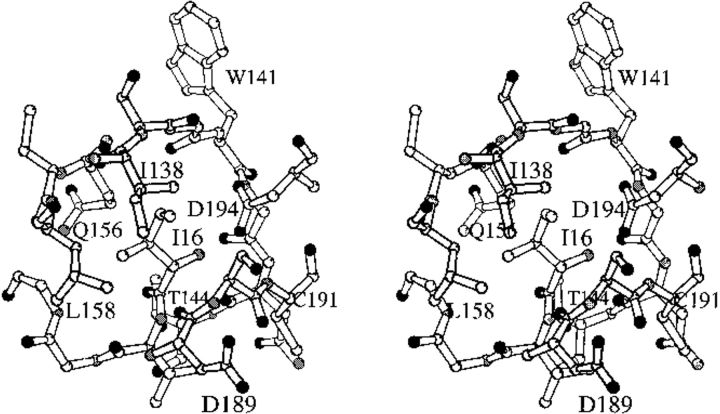
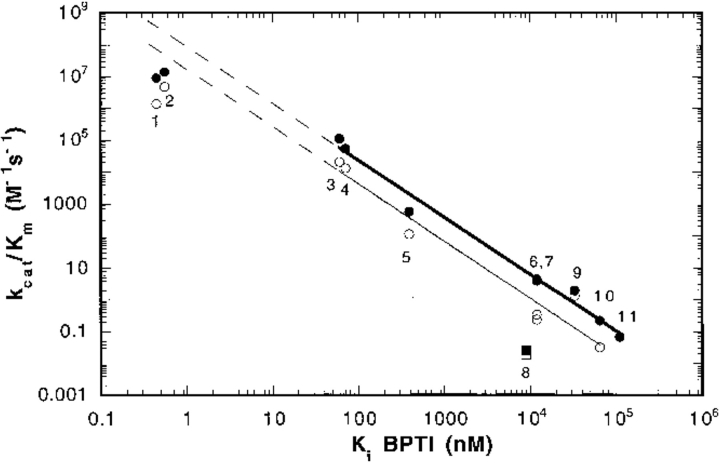
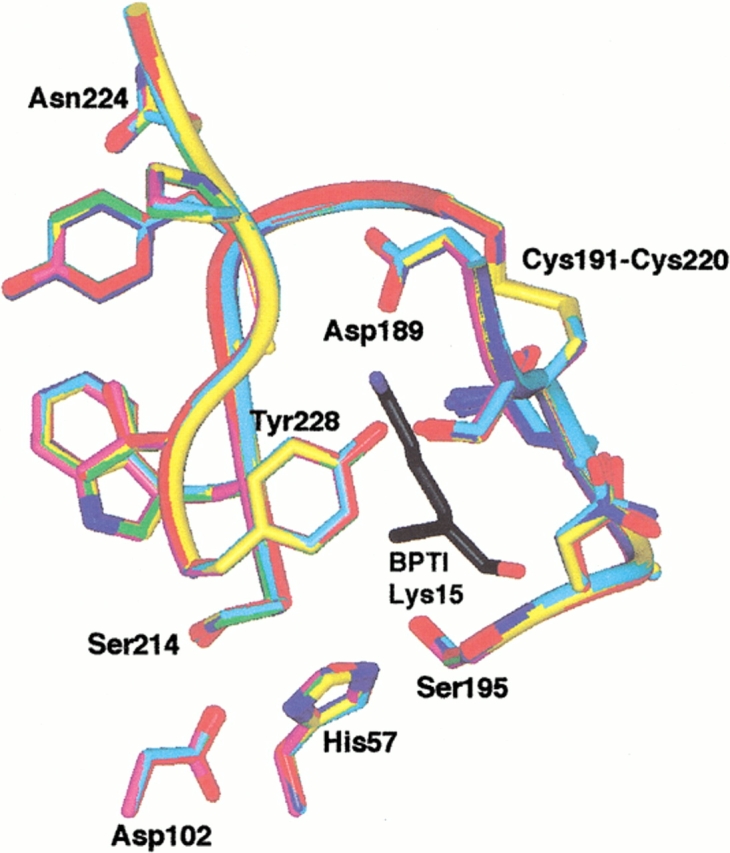
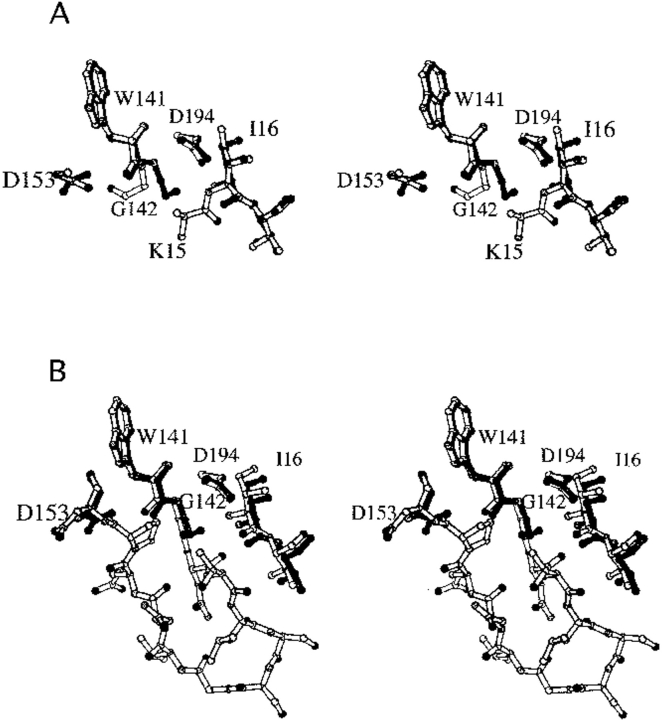
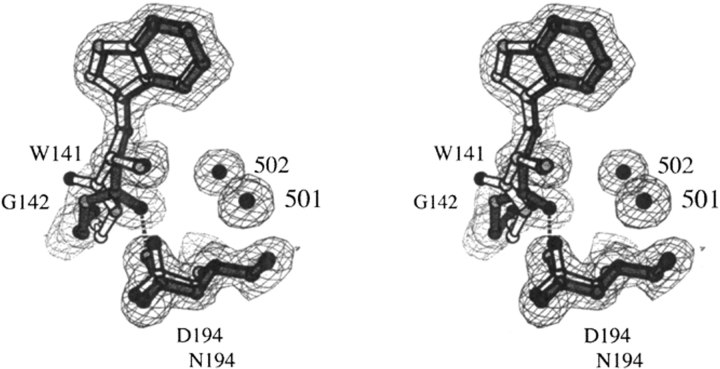
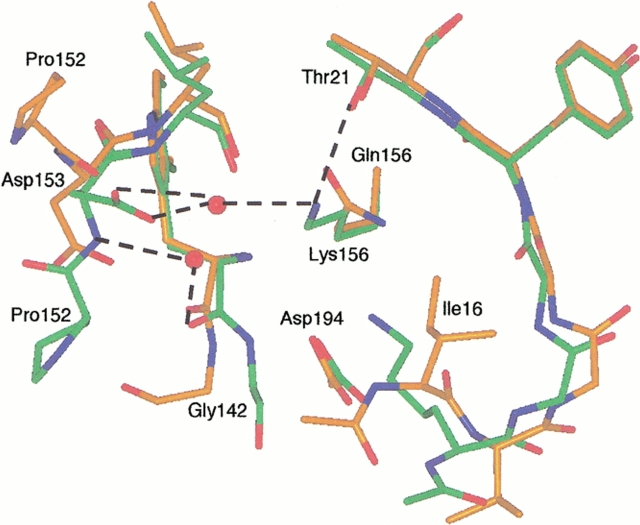
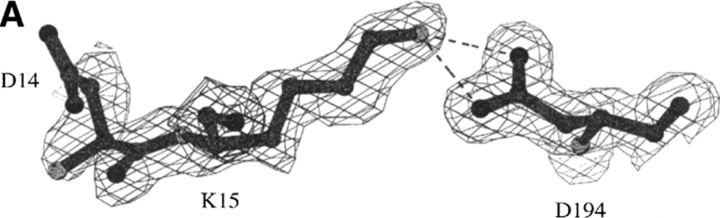
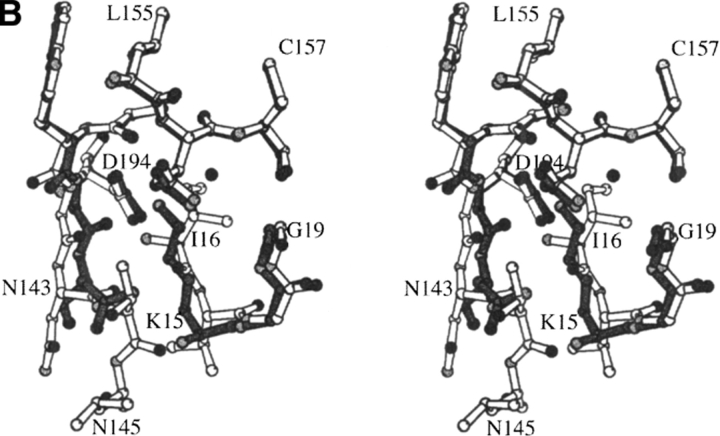
The contribution of induced fit to enzyme specificity has been much debated, although with little experimental data. Here we probe the effect of induced fit on enzyme specificity using the trypsin(ogen) system. BPTI is known to induce trypsinogen to assume a trypsinlike conformation. Correlations are observed between BPTI affinity and the values of k(cat)/K(m) for the hydrolysis of two substrates by eight trypsin(ogen) variants. The slope of both correlations is -1.8. The crystal structures of the BPTI complexes of four variant trypsinogens were also solved. Three of these enzymes, K15A, DeltaI16V17/D194N, and DeltaI16V17/Q156K trypsinogen, are 10- to 100-fold more active than trypsinogen. The fourth variant, DeltaI16V17 trypsinogen, is the lone outlier in the correlations; its activity is lower than expected based on its affinity for BPTI. The S1 site and oxyanion hole, formed by segments 184A-194 and 216-223, are trypsinlike in all of the enzymes. These structural and kinetic data confirm that BPTI induces an active conformation in the trypsin(ogen) variants. Thus, changes in BPTI affinity monitor changes in the energetic cost of inducing a trypsinlike conformation. Although the S1 site and oxyanion hole are similar in all four variants, the N-terminal and autolysis loop (residues 142-152) segments have different interactions for each variant. These results indicate that zymogen activity is controlled by a simple conformational equilibrium between active and inactive conformations, and that the autolysis loop and N-terminal segments control this equilibrium. Together, these data illustrate that induced fit does not generally contribute to enzyme specificity.


Figures

Fig. 1.
Fig. 1.
Schemes describing induced fit and conformational equilibrium. (A) Induced fit does not contribute to enzyme catalysis (Fersht 1985). E* denotes the active enzyme conformation; E, the inactive conformation; Kc*, the equilibrium constant for the interconversion of E and E*; S1 and S2, the two different substrates; and P1 and P2, their respective products. (B) The relationship between E′ and E*. I denotes the inhibitor; E′ indicates the enzyme conformation that binds inhibitor; Kc′, the equilibrium constant for the interconversion of E and E′; and S, the transition state structure of substrate S which is converted to product P. The experimental value of Ki measures the overall dissociation reaction of E′ • I to E and I as denoted by the diagonal. Similarly, the value of kcat/Km measured the transformation of E and S to E* • S. If E′ and E* are similar, then Kc′ and Kc*. should be related and a correlation will be observed between Ki and kcat/Km.
Fig. 2.
Fig. 2.
The structure of the rat trypsin-BPTI complex. The structure of rat trypsinogen has not been solved. Nevertheless, several lines of experimentation suggest that the activation domain of rat trypsinogen is disordered as observed in bovine trypsinogen (Pasternak et al. 1999). The four segments of the activation domain that are disordered in bovine trypsinogen (and presumably in rat trypsinogen) are shown in dark gray.
Fig. 3.
Fig. 3.
The structure of the Ile16 pocket of the wild-type trypsin-BPTI complex. Residues shown are Ile16-Gly19, Ile138-Thr144, Glu156-Leu158, Asp189-Cys191, and Asp194. The N-terminal amino group of Ile16 forms a salt bridge with the carboxylate group of Asp194. The side chain of Ile16 interacts with Ile138, Gln156, Leu158, and Ser190. The carboxylate of Asp194 also forms hydrogen bonds to the amide nitrogens of Gly142 and Cys191.
Fig. 4.
Fig. 4.
The correlation between BPTI affinity and kcat/Km for mutant rat trypsin(ogens). The values of the Ki of BPTI inhibition and kcat/Km for the hydrolysis of Tos-Gly-Pro-Arg-AMC (closed circles and square) and Tos-Gly-Pro-Lys-AMC (open circles and square) of the following rat trypsin(ogen) II mutants: wild-type (1), I16V trypsin (2), I16A trypsin (3), D194N trypsin (4), I16G trypsin (5), K15A trypsinogen (6), ΔI16V17/D194N trypsinogen (7), ΔI16V17 trypsinogen (8), ΔI trypsin (9), ΔI16V17/Q156K trypsinogen (10), and I16G trypsinogen (11). The data for ΔI16V17 trypsinogen (squares) were omitted from the correlation. Data for wild-type trypsin, D194N trypsin, I16V trypsin, I16A trypsin, and I16G trypsin were reported in Hedstrom et al. (1996); data for K15A trypsinogen, I16 trypsinogen, ΔI16V17/D194N trypsinogen, ΔI16 trypsin in Pasternak, et al. (1998); data for ΔI16V17/Q156K trypsinogen in this study; and data for ΔI16V17 trypsinogen in Pasternak, et al. (1998). No Tos-Gly-Pro-Lys-AMC data is available for I16G trypsinogen. The dashed lines show the extrapolation of the correlation to wild-type trypsin.
Fig. 5.
Fig. 5.
Active site structure of trypsin and mutant trypsin(ogens). The S1 site and oxyanion hole residues are shown. Lys15, the P1 residue of BPTI, is shown in black. The following color scheme is used: wild-type, purple; K15A trypsinogen, green; ΔI16V17/Q156K trypsinogen, yellow; S195A trypsinogen, red; ΔI16V17 trypsinogen, blue; and ΔI16V17/D194N trypsinogen, cyan. The structures were superimposed by least squares superposition of the backbone atoms of residues 20–140 and 154–245.
Fig. 6.
Fig. 6.
Structure of K15A trypsinogen-BPTI complex. (A) Stereo view of S195A trypsinogen (light bonds) and K15A trypsinogen (dark bonds) in their BPTI complexes. Ile16 and Asp194 have similar positions in both structures. In S195A trypsinogen, electron density is only observed for the β carbon of Lys15, whereas electron density is not observed for Ala15 in K15A trypsinogen. The autolysis loop is disordered in both structures, with electron density observed only for Trp141-Gly142 and Asp153. Nevertheless, it is clear that the autolysis loop has different conformations in the two structures as seen by the position of Gly142. The side chain of Lys15 would sterically clash with the autolysis loop conformation observed in the K15A trypsinogen structure. (B) Stereo view of wild-type trypsin (light bonds) and K15A trypsinogen (dark bonds) in their BPTI complexes. The entire autolysis loop is observed in the trypsin structure. The position of Gly142 in K15A trypsinogen is similar to that in trypsin, which suggests that the autolysis loop of K15A trypsinogen has a more trypsinlike conformation than S195A trypsinogen.
Fig. 7.
Fig. 7.
Structure of the ΔI16V17/D194N trypsinogen-BPTI (light bonds) and trypsin-BPTI complexes (dark bonds). Electron density is from a 2Fo-Fc map drawn at a contour level of 1.0 σ. The psi angle of Trp141 is rotated approximately 180° from its position in trypsin. The hydrogen bond (2.9 Å) between the carbonyl oxygen of Trp141 and the ND2 nitrogen of Asn194 is shown by the dotted lines.
Fig. 8.
Fig. 8.
Structure of the ΔI16V17/Q156K trypsinogen-BPTI (green) and S195A trypsinogen-BPTI complexes (orange). The dashed lines indicate hydrogen bonds. The hydrogen bonding distances are Lys156-Thr21, 3.0 Å; Lys156-water 633, 3.0 Å; and water 633-Asp153, 2.6Å. As in ΔI16V17 trypsinogen, Lys15 forms a salt bridge with Asp194 and can be seen overlaying Ile16 of S195A trypsinogen. The autolysis loop of ΔI16V17/Q156K trypsinogen assumes a trypsinlike conformation and is more ordered than in S195A trypsinogen, with electron density visible for Trp141-Gly142-Asn143 and Pro152-Asp153. Asp153 has two conformations (only one is shown for clarity) in the ΔI16V17/Q156K trypsinogen structure. Although only the β carbon of Lys15 is visible in S195A trypsinogen, it is clear that the side chain of Lys15 would clash with Asn153 in the trypsinlike conformation of ΔI16V17/Q156K trypsinogen.
Fig. 9.
Fig. 9.
Structure of the ΔI16V17 trypsinogen-BPTI complex. (A) The Lys15-Asp194 salt bridge. Dashed lines indicate hydrogen bonding distances of 3.0 Å (to OD1) and 2.6 Å (to OD2). Electron density is from a 2Fo-Fc map drawn at a contour level of 1.0 σ. (B) Stereo comparison of the Ile16 pocket of trypsin (white bonds) and ΔI16V17 trypsinogen (dark bonds). In the absence of Ile16-Val17, Lys15 occupies the Ile16 pocket, forming a salt bridge with Asp194. A cavity exists in ΔIle16Val17 trypsinogen-BPTI, where the sidechain of Ile16 would be in wild-type trypsin. Water molecule 560 resides in this cavity. Although the N terminus is not shown beyond residue 15 for ΔIle16Val17 trypsinogen-BPTI, electron density is observed for residue 14.
Fig. 9.
Fig. 9.
Structure of the ΔI16V17 trypsinogen-BPTI complex. (A) The Lys15-Asp194 salt bridge. Dashed lines indicate hydrogen bonding distances of 3.0 Å (to OD1) and 2.6 Å (to OD2). Electron density is from a 2Fo-Fc map drawn at a contour level of 1.0 σ. (B) Stereo comparison of the Ile16 pocket of trypsin (white bonds) and ΔI16V17 trypsinogen (dark bonds). In the absence of Ile16-Val17, Lys15 occupies the Ile16 pocket, forming a salt bridge with Asp194. A cavity exists in ΔIle16Val17 trypsinogen-BPTI, where the sidechain of Ile16 would be in wild-type trypsin. Water molecule 560 resides in this cavity. Although the N terminus is not shown beyond residue 15 for ΔIle16Val17 trypsinogen-BPTI, electron density is observed for residue 14.
Fig. 10.
Fig. 10.
The serine protease reaction (Bartlett and Marlowe 1983).

References

    1. Bartlett, P.A. and Marlowe, C.K. 1983. Phosphonoamidates as transition state analogue inhibitors of thermolysin. Biochemistry 22 4618–4624. - PubMed
    1. Bode, W. and Huber, R. 1976. Induction of the bovine trypsinogen-trypsin transition by peptides sequentially similar to the N terminus of trypsin. FEBS Lett. 68 231–236. - PMC - PubMed
    1. Bolognesi, M., Gatti, G., Menegatti, E., Guarneri, M., Marquart, M., Papamokos, E., and Huber, R. 1982. Three dimensional structure of the complex between pancreatic secretory trypsin inhibitor (Kazal type) and trypsinogen at 1.8 α resolution: Structure solution, crystallographic refinement and preliminary structural interpretation. J. Mol. Biol. 162 839–868. - PubMed
    1. Boose, J.A., Kuismanen, E., Gerard, R., Sambrook, J., and Gething, M.-J. 1989. The single chain form of tissue-type plasminogen activator has catalytic activity: Studies with a mutant enzyme that lacks the cleavage site. Biochemistry 28 635–643. - PubMed
    1. Brady, K. and Abeles, R.H. 1990. Inhibition of chymotrypsin by peptidyl trifluoromethyl ketones: Determinants of slow binding kinetics. Biochemistry 29 7608–7617. - PubMed

Publication types

LinkOut - more resources