. 2001 Jul;10(7):1415-25.
doi: 10.1110/ps.42601.

A critical investigation of the Tanford-Kirkwood scheme by means of Monte Carlo simulations

Affiliations

A critical investigation of the Tanford-Kirkwood scheme by means of Monte Carlo simulations

F L Da Silva et al. Protein Sci. 2001 Jul.

Abstract

Monte Carlo simulations are used to assess the adequacy of the Tanford-Kirkwood prescription for electrostatic interactions in macromolecules. Within a continuum dielectric framework, the approach accurately describes salt screening of electrostatic interactions for moderately charged systems consistent with common proteins at physiological conditions. The limitations of the Debye-Hückel theory, which forms the statistical mechanical basis for the Tanford-Kirkwood result, become apparent for highly charged systems. It is shown, both by an analysis of the Debye-Hückel theory and by numerical simulations, that the difference in dielectric permittivity between macromolecule and surrounding solvent does not play a significant role for salt effects if the macromolecule is highly charged. By comparison to experimental data, the continuum dielectric model (combined with either an approximate effective Hamiltonian as in the Tanford-Kirkwood treatment or with exact Monte Carlo simulations) satisfactorily predicts the effects of charge mutation on metal ion binding constants, but only if the macromolecule and solvent are assigned the same or similar permittivities.


Figures
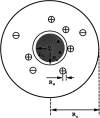
Fig. 1.
Fig. 1.
Schematic representation of the model systems (see also Table 1). A spherical protein in a spherical cell with radii Rp and RC, respectively. The protein interior with a low dielectric permittivity is shown as a shaded region of radius Rd < Rp. A central charge of valency Z and two binding sites marked as black dots.
Fig. 2.
Fig. 2.
The reduced excess chemical potential for a free divalent cation in a 20 μM protein solution is indicated as a function of monovalent salt concentration. The (superimposed) solid lines refer to the SC8 model and the broken lines to the SC24 model. Lines marked by solid circles are calculated with a dielectric boundary radius Rd = 14Å; lines without symbols refer to Rd = 0Å. The thin broken line shows the excess chemical potential of a divalent ion in a bulk salt solution.
Fig. 3.
Fig. 3.
The reduced excess chemical potential for a divalent cation as a function of protein concentration with a homogeneous dielectric response (dielectric radius Rd = 0). The solid lines refer to the SC8 model and the broken lines to the SC24 model. Lines marked by circles denote a monovalent simple electrolyte concentration of cs = 100 mM; lines without symbols are for cs = 1 mM. The arrows indicate the value of βμFex in the corresponding bulk salt solutions. The upper arrow indicates the system at cs = 1 mM (βμFex = −0.156).
Fig. 4.
Fig. 4.
(a) Total shift in ion binding constant ΔpK, owing to solution ionic strength, is plotted as a function of salt concentration cs for the SC8 model. A reference state at cs = 1 mM is chosen and the protein is allowed to bind two divalent cations. Results from MC simulations and TK calculations are compared as solid and broken lines, respectively. Lines marked by solid circles correspond to a dielectric boundary radius Rd = 18Å and those marked by open squares denote Rd = 12Å; unmarked lines refer to a homogeneous dielectric response (Rd = 0Å). (b) The shift of ΔpK arising from the presence of an interior vacuum ΔΔpK = ΔpK (Rd = 0Å) − ΔpK (Rd = 14Å) is demonstrated as a function of salt concentration cs. In the solvent region, the relative dielectric permittivity is ɛs = 78.7. Solid line shows MC data and broken line indicates TK results. (c) Total shift in ion binding constant ΔpK, owing to solution ionic strength, is plotted as a function of salt concentration cs for a spherical protein model with eight randomly placed negative charges. Results from MC simulations and TK calculations are compared as solid line and solid circles, respectively. The protein dielectric boundary radius was Rd = 12Å in all calculations.
Fig. 4.
Fig. 4.
(a) Total shift in ion binding constant ΔpK, owing to solution ionic strength, is plotted as a function of salt concentration cs for the SC8 model. A reference state at cs = 1 mM is chosen and the protein is allowed to bind two divalent cations. Results from MC simulations and TK calculations are compared as solid and broken lines, respectively. Lines marked by solid circles correspond to a dielectric boundary radius Rd = 18Å and those marked by open squares denote Rd = 12Å; unmarked lines refer to a homogeneous dielectric response (Rd = 0Å). (b) The shift of ΔpK arising from the presence of an interior vacuum ΔΔpK = ΔpK (Rd = 0Å) − ΔpK (Rd = 14Å) is demonstrated as a function of salt concentration cs. In the solvent region, the relative dielectric permittivity is ɛs = 78.7. Solid line shows MC data and broken line indicates TK results. (c) Total shift in ion binding constant ΔpK, owing to solution ionic strength, is plotted as a function of salt concentration cs for a spherical protein model with eight randomly placed negative charges. Results from MC simulations and TK calculations are compared as solid line and solid circles, respectively. The protein dielectric boundary radius was Rd = 12Å in all calculations.
Fig. 5.
Fig. 5.
(a) Total shift in ion binding constant ΔpK, owing to solution ionic strength, is plotted as a function of salt concentration cs for the SC24 model. Other details are as for Fig. 4A ▶. (b) The difference of excess chemical potentials βΔμBex = βμBex(cs) − βμBex(cs = 1 mM) for a divalent cation in a bulk monovalent electrolyte solution is plotted as a function of salt concentration cs.
Fig. 5.
Fig. 5.
(a) Total shift in ion binding constant ΔpK, owing to solution ionic strength, is plotted as a function of salt concentration cs for the SC24 model. Other details are as for Fig. 4A ▶. (b) The difference of excess chemical potentials βΔμBex = βμBex(cs) − βμBex(cs = 1 mM) for a divalent cation in a bulk monovalent electrolyte solution is plotted as a function of salt concentration cs.
Fig. 6.
Fig. 6.
Total shift in ion binding constant ΔpK, owing to solution ionic strength, is plotted as a function of the protein net charge (Z). A reference state at salt concentration cs = 1 mM is chosen and the final salt concentration is 500 mM. Results from MC simulations and TK calculations are compared as solid and broken lines, respectively. Lines marked by solid circles correspond to a dielectric boundary radius Rd = 12Å; unmarked lines refer to a homogeneous dielectric response (Rd = 0Å).
Fig. 7.
Fig. 7.
Total shift in ion binding constant ΔpK, owing to solution ionic strength, is plotted as a function of the dielectric radius Rd for the SC8 model. A reference state at salt concentration cs = 1 mM is chosen and the protein (of radius Rp = 14Å) is allowed to bind two divalent cations. Results from MC simulations and TK calculations are compared as solid and broken lines, respectively.
Fig 8.
Fig 8.
Total shift in ion binding constant ΔpK, owing to solution ionic strength, is plotted as a function of the dielectric radius Rd for the SC24 model. A reference state at salt concentration cs = 1 mM is chosen and the protein (of radius Rp = 14Å) is allowed to bind two divalent cations. The final salt concentration is 500 mM. Results from MC simulations and TK calculations are compared as open and solid symbols, respectively, joined by straight line segments to guide the eye.
Fig. 9.
Fig. 9.
Total shift in ion binding constant ΔpK, owing to a single charge mutation, is plotted as a function of the dielectric radius Rd for the SC8 and SP8 models. The salt concentration is cs = 1 mM and the protein concentration is cp = 0.02 mM. MC results are shown with solid (SC8) and broken (SP8) lines; TK data are denoted by solid circles.

Similar articles

Cited by

References

    1. Antonsiewicz, J., McCammon, J.A., and Gilson, M.K. 1994a. The determinants of pKas in proteins. Biochemistry 35 7819–7833. - PubMed
    1. Antonsiewicz, J., McCammon, J.A., and Gilson, M.K. 1994b. Prediction of pH-dependence properties of proteins. J. Mol. Biol. 238 415–436. - PubMed
    1. Bashford, D. and Gerwert, K. 1992. Electrostatic calculations of the pKa values of ionizable groups in bacteriorhodopsin. J. Mol. Biol. 224 473–486. - PubMed
    1. Bashford, D. and Karplus, M. 1990. pKa's of ionizable groups in proteins: Atomic detail from a continuum electrostatic model. Biochemistry 29 10219–10225. - PubMed
    1. Bashford, D., Karplus, M., and Canters, G.W. 1988. Electrostatic effects of charge pertubations introduced by metal oxidation in proteins—a theoretical analysis. J. Mol. Biol. 203 507–510. - PubMed

Publication types

LinkOut - more resources