

Chromophore structure in lumirhodopsin and metarhodopsin I by time-resolved resonance Raman microchip spectroscopy
- PMID: 11425321
- PMCID: PMC1404555
- DOI: 10.1021/bi010670x
Chromophore structure in lumirhodopsin and metarhodopsin I by time-resolved resonance Raman microchip spectroscopy
Abstract
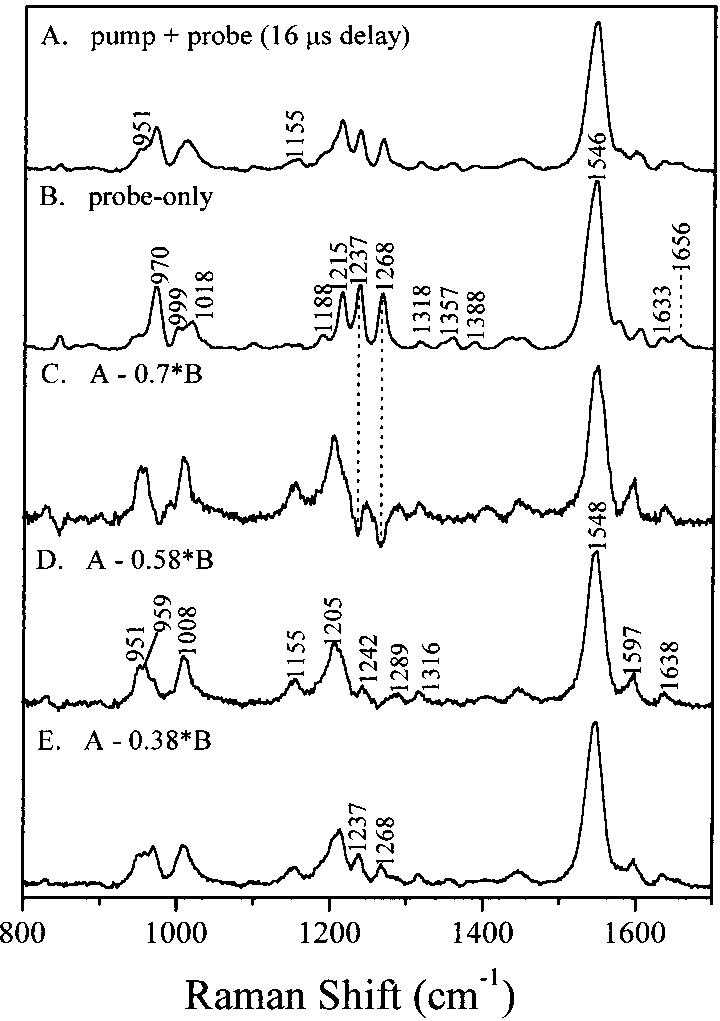
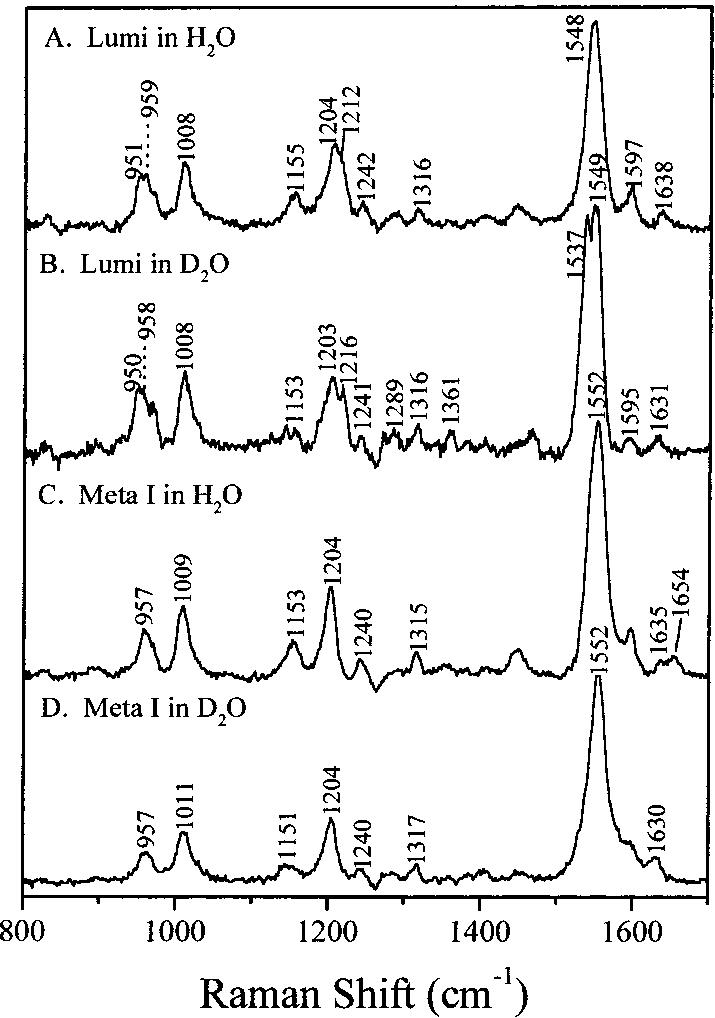
Time-resolved resonance Raman microchip flow experiments have been performed on the lumirhodopsin (Lumi) and metarhodopsin I (Meta I) photointermediates of rhodopsin at room temperature to elucidate the structure of the chromophore in each species as well as changes in protein-chromophore interactions. Transient Raman spectra of Lumi and Meta I with delay times of 16 micros and 1 ms, respectively, are obtained by using a microprobe system to focus displaced pump and probe laser beams in a microfabricated flow channel and to detect the scattering. The fingerprint modes of both species are very similar and characteristic of an all-trans chromophore. Lumi exhibits a relatively normal hydrogen-out-of-plane (HOOP) doublet at 951/959 cm(-1), while Meta I has a single HOOP band at 957 cm(-1). These results suggest that the transitions from bathorhodopsin to Lumi and Meta I involve a relaxation of the chromophore to a more planar all-trans conformation and the elimination of the structural perturbation that uncouples the 11H and 12H wags in bathorhodopsin. Surprisingly, the protonated Schiff base C=N stretching mode in Lumi (1638 cm(-1)) is unusually low compared to those in rhodopsin and bathorhodopsin, and the C=ND stretching mode shifts down by only 7 cm(-1) in D2O buffer. This indicates that the Schiff base hydrogen bonding is dramatically weakened in the bathorhodopsin to Lumi transition. However, the C=N stretching mode in Meta I is found at 1654 cm(-1) and exhibits a normal deuteration-induced downshift of 24 cm(-1), identical to that of the all-trans protonated Schiff base. The structural relaxation of the chromophore-protein complex in the bathorhodopsin to Lumi transition thus appears to drive the Schiff base group out of its hydrogen-bonded environment near Glu113, and the hydrogen bonding recovers to a normal solvated PSB value but presumably a different hydrogen bond acceptor with the formation of Meta I.
Figures


References
-
- Mathies RA, Lugtenburg J. In: Handbook of Biological Physics, Molecular Mechanism of Vision (Part 1) Stavenga DG, DeGrip WJ, Pugh EN Jr., editors. Elsevier Science Press; Amsterdam: 2000. pp. 55–99.
-
- Schoenlein RW, Peteanu LA, Mathies RA, Shank CV. Science. 1991;254:412–415. - PubMed
-
- Kliger DS, Lewis JW. Isr. J. Chem. 1995;35:289–307.
-
- Stryer L. Annu. Rev. Neurosci. 1986;9:87–119. - PubMed
Publication types
MeSH terms
Substances
Grants and funding
LinkOut - more resources
Full Text Sources
