. 2001 Jul;67(7):2982-92.
doi: 10.1128/AEM.67.7.2982-2992.2001.

Quorum sensing in the dimorphic fungus Candida albicans is mediated by farnesol

Affiliations

Quorum sensing in the dimorphic fungus Candida albicans is mediated by farnesol

J M Hornby et al. Appl Environ Microbiol. 2001 Jul.

Abstract

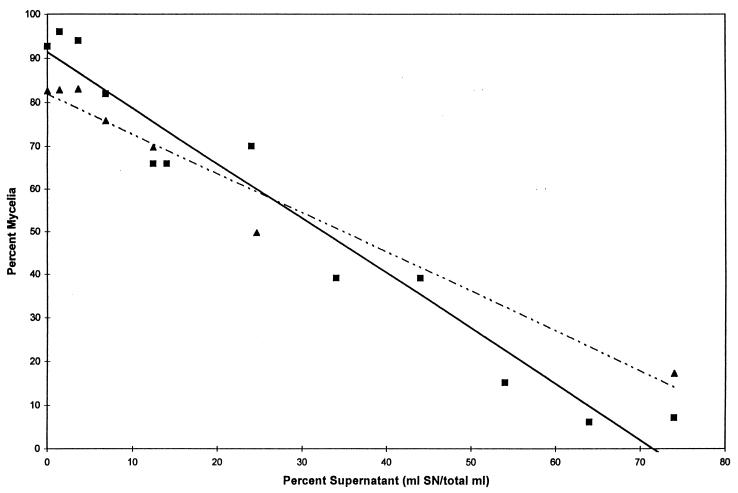
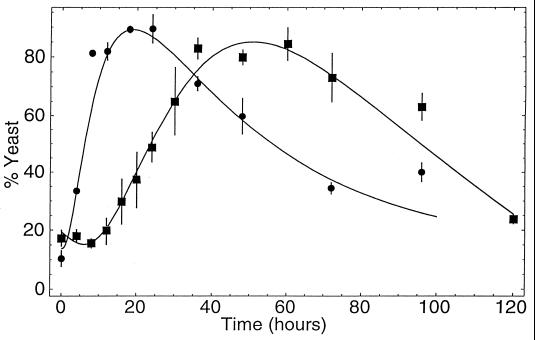
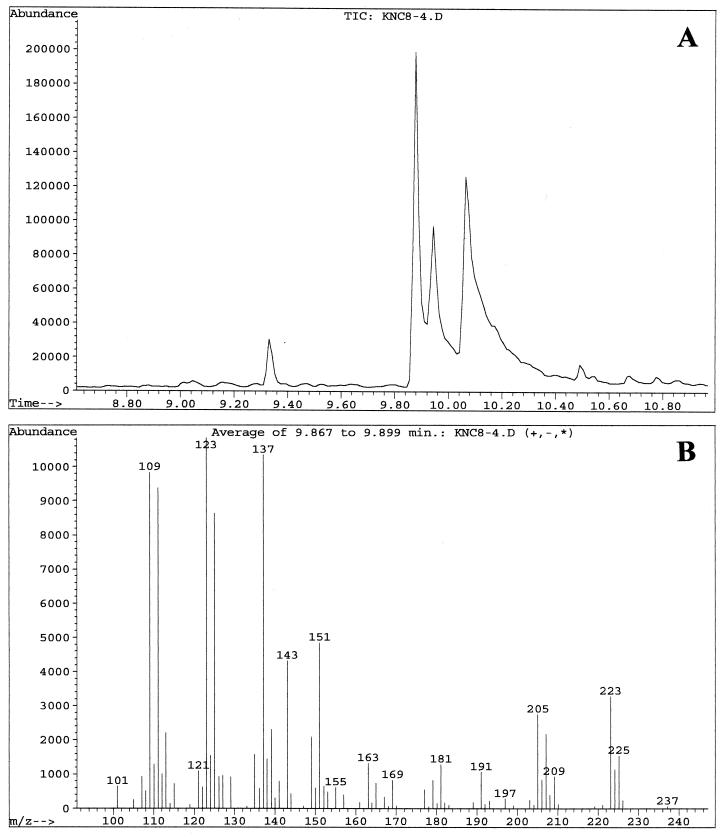
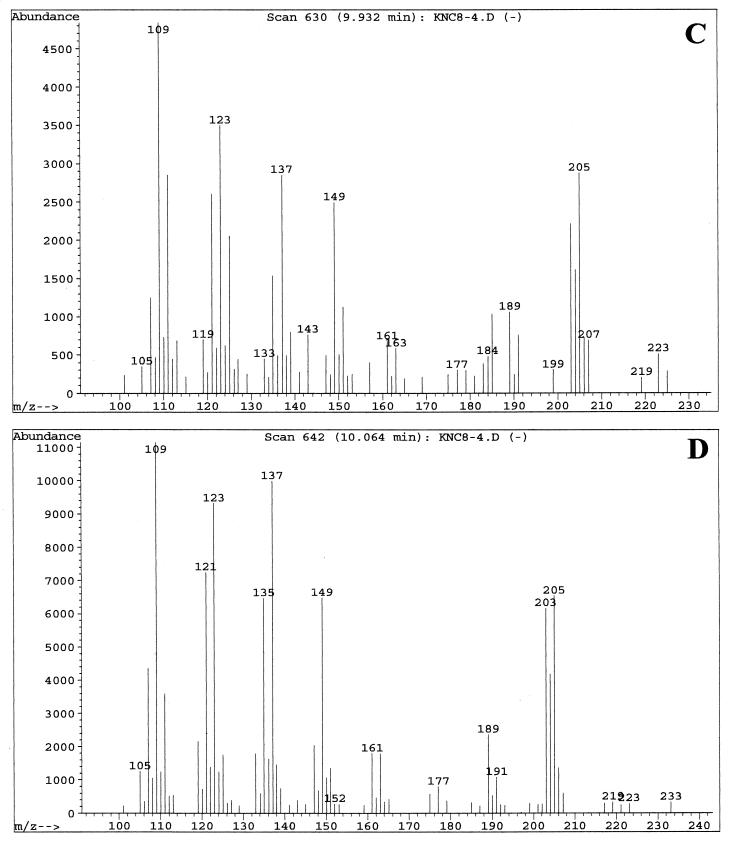
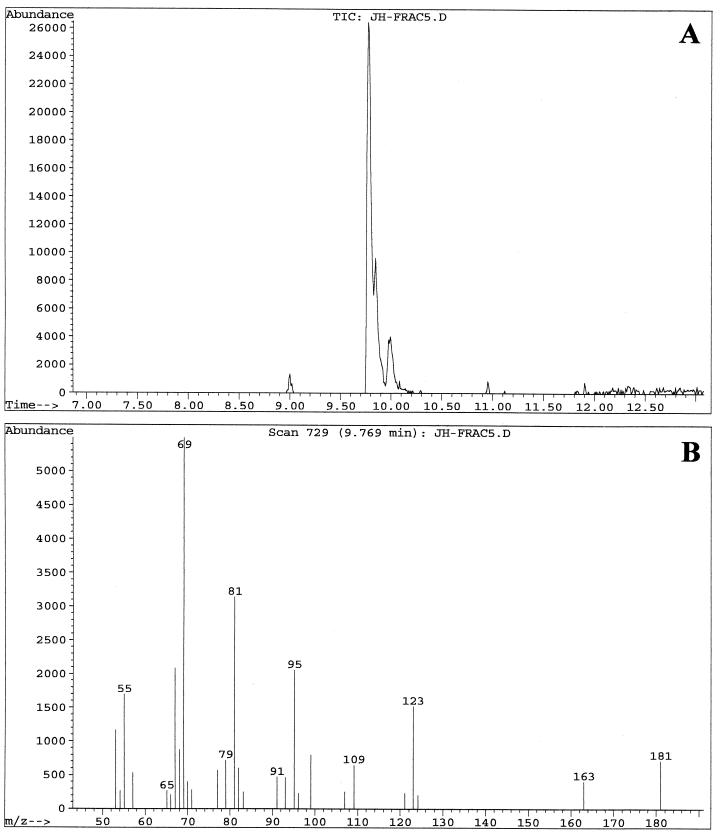
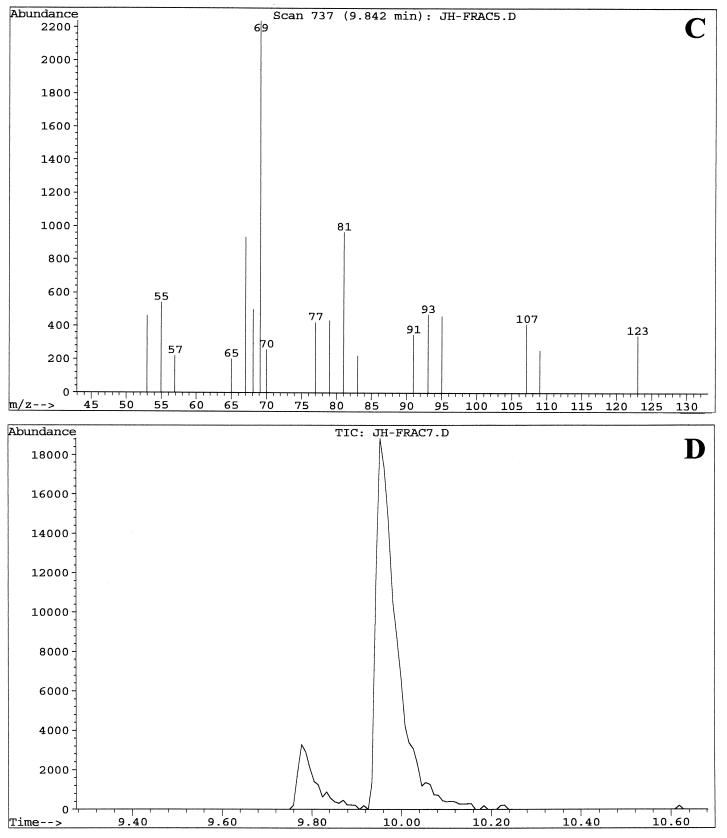
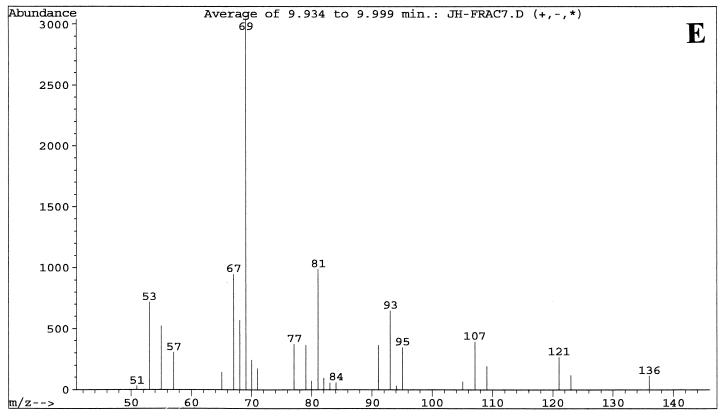
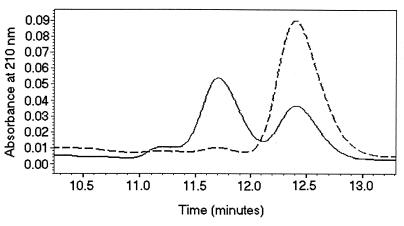
The inoculum size effect in the dimorphic fungus Candida albicans results from production of an extracellular quorum-sensing molecule (QSM). This molecule prevents mycelial development in both a growth morphology assay and a differentiation assay using three chemically distinct triggers for germ tube formation (GTF): L-proline, N-acetylglucosamine, and serum (either pig or fetal bovine). In all cases, the presence of QSM prevents the yeast-to-mycelium conversion, resulting in actively budding yeasts without influencing cellular growth rates. QSM exhibits general cross-reactivity within C. albicans in that supernatants from strain A72 are active on five other strains of C. albicans and vice versa. The QSM excreted by C. albicans is farnesol (C(15)H(26)O; molecular weight, 222.37). QSM is extracellular, and is produced continuously during growth and over a temperature range from 23 to 43 degrees C, in amounts roughly proportional to the CFU/milliliter. Production is not dependent on the type of carbon source nor nitrogen source or on the chemical nature of the growth medium. Both commercial mixed isomer and (E,E)-farnesol exhibited QSM activity (the ability to prevent GTF) at a level sufficient to account for all the QSM activity present in C. albicans supernatants, i.e., 50% GTF at ca. 30 to 35 microM. Nerolidol was ca. two times less active than farnesol. Neither geraniol (C(10)), geranylgeraniol (C(20)), nor farnesyl pyrophosphate had any QSM activity.


Figures

FIG. 1
FIG. 1
Two bioassays for QSM activity. Symbols: ■ and solid line, GlcNAc-triggered differentiation assay; ▴ and dotted line, mycelial growth assay. The indicated lines are linear regression lines with R2 values of 0.953 and 0.964, respectively. Values represent the average of five or more experiments conducted over the past 4 years.
FIG. 2
FIG. 2
QSM production versus time. Supernatant samples were removed at the indicated times and used in the mycelial growth assay. Thus, a higher percent yeast indicates more QSM activity. Values are the average of triplicate experiments. Symbols: ●, initial cell density of 107/ml; ■, initial cell density of 105/ml. pH and CFU/milliliter values were also determined at each time point. The two cultures shifted from exponential to stationary phase at ca. 12 and 48 h, respectively, at a cell density of 2.8 × 10⁸/ml in both cases.
FIG. 3
FIG. 3
GC-MS analysis of QSMs from C. albicans using the CI mode for MS. Samples were run in August 1997. (A) GC showing peak A at 9.88 min, peak B at 9.93 min, and peak C at 10.06 min. (B) MS fragmentation pattern of peak A. (C) MS fragmentation pattern of peak B. (D) MS fragmentation pattern of peak C. The MS patterns only show ions of ≥100 m/z.
FIG. 3
FIG. 3
GC-MS analysis of QSMs from C. albicans using the CI mode for MS. Samples were run in August 1997. (A) GC showing peak A at 9.88 min, peak B at 9.93 min, and peak C at 10.06 min. (B) MS fragmentation pattern of peak A. (C) MS fragmentation pattern of peak B. (D) MS fragmentation pattern of peak C. The MS patterns only show ions of ≥100 m/z.
FIG. 4
FIG. 4
GC-MS analysis of two QSM-containing column fractions (fractions 5 and 7) using the EI mode for MS. Samples were run in September 2000. (A) GC of fraction 5 showing peak A at 9.77 min, peak B at 9.84 min, and peak C at 9.98 min. (B) MS fragmentation pattern of peak A from fraction 5. (C) MS fragmentation pattern of peak B from fraction 5. (D) GC of fraction 7 showing primarily peak C at 9.98 min. (E) MS fragmentation pattern of peak C from fraction 7. The MS patterns show ions of ≥50 m/z. The strong band at m/z 69 is characteristic of a C5H9 isoprene unit.
FIG. 4
FIG. 4
GC-MS analysis of two QSM-containing column fractions (fractions 5 and 7) using the EI mode for MS. Samples were run in September 2000. (A) GC of fraction 5 showing peak A at 9.77 min, peak B at 9.84 min, and peak C at 9.98 min. (B) MS fragmentation pattern of peak A from fraction 5. (C) MS fragmentation pattern of peak B from fraction 5. (D) GC of fraction 7 showing primarily peak C at 9.98 min. (E) MS fragmentation pattern of peak C from fraction 7. The MS patterns show ions of ≥50 m/z. The strong band at m/z 69 is characteristic of a C5H9 isoprene unit.
FIG. 5
FIG. 5
HPLC comparison of mixed-isomer farnesol versus active fraction 7 from C. albicans supernatant. The separation used a C18 reversed phase column eluted with 80% methanol-water monitored at 210 nm. The mixed-isomer farnesol peaks at 11.2, 11.7, and 12.4 min were present (percent area) in the ratio of 6:56:38. The solid line represents 0.4 mM mixed-isomer farnesol.

References

    1. Atlas R M. Handbook of microbiological media. Boca Raton, Fla: CRC Press; 1993.
    1. Bard M, Albrecht M R, Gupta N, Guynn C J, Stilwell W. Geraniol interferes with membrane functions in strains of Candida and Saccharomyces. Lipids. 1988;23:534–538. - PubMed
    1. Brown A J P, Gow N A R. Regulatory networks controlling Candida albicans morphogenesis. Trends Microbiol. 1999;7:333–338. - PubMed
    1. Caldwell G A, Naider F, Becker J M. Fungal lipopeptide mating pheromones: a model system for the study of protein prenylation. Microbiol Rev. 1995;59:406–422. - PMC - PubMed
    1. Cha C, Gao P, Chen Y-C, Shaw P D, Farrand S K. Production of acyl-homoserine lactone quorum sensing signals by gram-negative plant-associated bacteria. Mol Plant-Microbe Interact. 1998;11:1119–1129. - PubMed

MeSH terms

LinkOut - more resources