. 2001 Jul 1;21(13):4609-24.
doi: 10.1523/JNEUROSCI.21-13-04609.2001.

Differential expression of genes encoding subthreshold-operating voltage-gated K+ channels in brain

Affiliations

Differential expression of genes encoding subthreshold-operating voltage-gated K+ channels in brain

M J Saganich et al. J Neurosci. .

Abstract

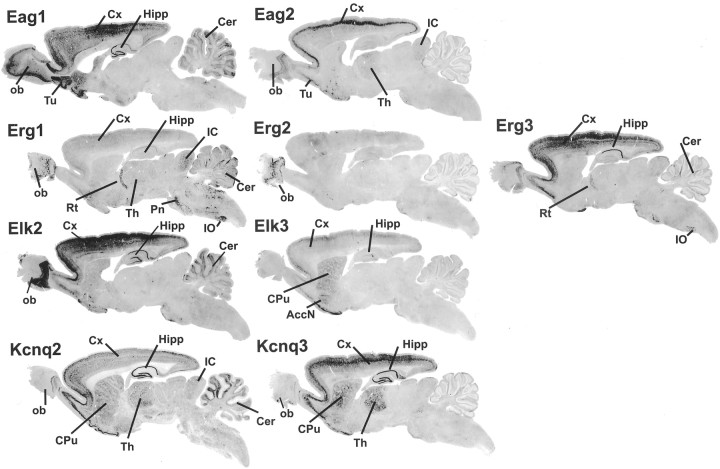
The members of the three subfamilies (eag, erg, and elk) of the ether-a-go-go (EAG) family of potassium channel pore-forming subunits express currents that, like the M-current (I(M)), could have considerable influence on the subthreshold properties of neuronal membranes, and hence the control of excitability. A nonradioactive in situ hybridization (NR-ISH) study of the distribution of the transcripts encoding the eight known EAG family subunits in rat brain was performed to identify neuronal populations in which the physiological roles of EAG channels could be studied. These distributions were compared with those of the mRNAs encoding the components of the classical M-current (Kcnq2 and Kcnq3). NR-ISH was combined with immunohistochemistry to specific neuronal markers to help identify expressing neurons. The results show that each EAG subunit has a specific pattern of expression in rat brain. EAG and Kcnq transcripts are prominent in several types of excitatory neurons in the cortex and hippocampus; however, only one of these channel components (erg1) was consistently expressed in inhibitory interneurons in these areas. Some neuronal populations express more than one product of the same subfamily, suggesting that the subunits may form heteromeric channels in these neurons. Many neurons expressed multiple EAG family and Kcnq transcripts, such as CA1 pyramidal neurons, which contained Kcnq2, Kcnq3, eag1, erg1, erg3, elk2, and elk3. This indicates that the subthreshold current in many neurons may be complex, containing different components mediated by a number of channels with distinct properties and neuromodulatory responses.


Figures

Fig. 1.
Fig. 1.
Differential expression of EAG and Kcnq K+ channels in brain. NR-ISH for EAG family and Kcnq K+ channel transcripts in rat brain using DIG-labeled RNA antisense probes is shown. DIG-labeled probes were detected using the alkaline phosphatase substrate NBT/BCIP for 14 hr. AccN, Accumbens nucleus; CPu, caudate/putamen; Cx, cerebral cortex;Cer, cerebellum; Hipp, hippocampus;IC, inferior colliculus; IO, inferior olive; ob, olfactory bulb; Pn, pontine nucleus; Rt, reticular thalamic nucleus;Th, thalamus; Tu, olfactory tubercle.
Fig. 2.
Fig. 2.
Eag1 and eag2 transcripts have overlapping expression in the cerebral cortex, olfactory bulb, and amygdala.A–D, ISH with DIG-labeled eag1 antisense probe.A, Eag1 expression in coronal section at the level of the hippocampus showing strong labeling in the cerebral cortex (Cx), hippocampus (Hipp), and lateral nuclei of the amygdala (La). B, High magnification of A showing eag1 expression in the cerebral cortex with specific lamina identified. Note labeling in layers II–VI, with particular high expression levels in layer IV.C, Eag1 expression in the hippocampus showing strongest signals in the CA2 and CA3 fields and in the dentate gyrus (DG). D, Eag1 staining of the granule cell layer (Gr) of the cerebellum. E–H, ISH using eag2 DIG-labeled antisense probe. E, Eag2 expression in serial section of the same brain as A. Note strong expression in cerebral cortex (Cx) and much weaker signals in the thalamus (Th) and lateral amygdala (La). F, High magnification of the cortex shows eag2 expression in layer IV. Unlike eag1, little or no eag2 expression was found in the hippocampus (G) or the cerebellar cortex (H).I–J, Overlapping expression of eag1 (I) and eag2 (J) transcripts was also found in the internal granule layer (IGr) and the mitral cell layer (Mi) of the olfactory bulb. Scale bar (shown in J):A, E, 1500 μm; B,F, 150 μm; I,J, 500 μm; C, D,G, H, 600 μm.ML, Molecular layer of the cerebellum;Gl, periglomerular layer of the olfactory bulb.
Fig. 3.
Fig. 3.
Eag1 and eag2 transcripts are not found in inhibitory cells of the cortex. A–D, Dual detection of eag1 and GAD in cortical layer IV. A, Low-magnification bright-field image of eag1 expression in cortical layer IV.B, High-magnification bright-field image ofA showing eag1 expression in many small non-pyramidal neurons. C, Immunofluorescent detection of GAD immunoreactive interneurons. D, Overlay ofB and C with eag1 expression pseudocolored green. Note GAD+ neurons are not labeled for eag1 (arrows). E–H, Same asA–D, but for eag2. Note eag2 transcripts do not colocalize with GAD+ immunoreactive neurons (arrows). Scale bar (shown in H): B–D,F–H, 50 μm; A, E, 200 μm.
Fig. 4.
Fig. 4.
Characterization of eag2 expression in the cerebral cortex. A, Changes in eag2 expression with cortical region. Eag2-expressing neurons are more abundant in somatosensory cortex (SS) as compared with the striate (Str) and frontal (Fr) cortical regions.B, ISH for eag2 in tangential sections through rat somatosensory barrel cortex reveals a whisker barrel pattern with hollow centers. C–E, Combined ISH for eag2 and immunofluorescent detection of NeuN in a coronal section through rat somatosensory barrel cortex. C, Fluorescent detection of all neurons using NeuN antibodies. D, Same section in bright field showing labeling for eag2 by ISH. Note that eag2 staining demarcated cortical layer IV with strong labeling of neurons lining the barrel sides (arrows), as well as neurons on the margins between layer IV and neighboring layers. E, Overlay ofC and D with eag2 pseudocoloredgreen, and NeuN red. F–K, High-magnification images of C identifying eag2-positive neurons along barrel sides in cortical layers IV (FH) and in deep cortical layer III (IK). Note that eag2-positive neurons in layer IV are small and non-pyramidal and have a star-shaped appearance (F–H, arrows). In contrast, eag2-positive cells in deep layer III are clearly pyramidal in shape with identifiable apical dendrites that are orientated toward the pia surface (I–K,arrow). Scale bar (shown in K):A, 400 μm; B, 575 μm; C–E, 500 μm;F–K, 50 μm.
Fig. 5.
Fig. 5.
Overlapping expression of Erg mRNA transcripts occurs in the reticular thalamus, cerebellum, hippocampus, and olfactory bulb. A, ISH with erg1 antisense probe. Note that erg1 expression was relatively weak with the exception of the reticular thalamic nucleus (Rt). Weaker expression was found in the cerebral cortex (Cx), hippocampus (Hipp), thalamus (Th), and ventral medial hypothalamic nuclei (VMH). B, ISH with erg3 antisense probe. Erg3 expression was strong in the cerebral cortex (Cx) and the CA1 subfield of the hippocampus (CA1). Weaker erg3 expression was also found in theRt and the VMH. C–D, Expression of erg1 and erg3 mRNA in cerebral cortex.C, High magnification of the cortex in Ashowing weak erg1 expression throughout cortical layers II–V.D, High magnification of B showing strong erg3-positive neurons in layers II/III and V. E,F, Expression of erg1 and erg3 transcripts, respectively, in the cerebellar cortex. Note that both transcripts were found in the Purkinje cell layer (PL). Comparison at low power revealed that only erg1 was found in the granule cell layer (E, F, top panels).G, Colocalization of erg1 (top), erg2 (middle), and erg3 (bottom) in the olfactory bulb. Erg1 and erg3 transcripts were located in neurons of the internal granule layer (IGr), mitral cell layer (Mi), and periglomerular layer (GL). Erg2 transcripts, however, were located only within the mitral cell layer and the periglomerular cell layer. Scale bar (shown inG): A, B, 2000 μm;C, D, 200 μm; E,F (top), 720 μm; E, F (bottom), 360 μm; G, 500 μm.
Fig. 6.
Fig. 6.
Erg1, but not erg3, is located in PV-containing interneurons throughout the hippocampus, but both are coexpressed in CA1 pyramidal cells. A–G, ISH using erg1 antisense probe. A, Erg1 expression within the CA1 pyramidal cell layer and scattered cells throughout the hippocampus.B–D, Dual labeling for erg1 and PV in the CA1 subfield.B, Bright-field image of erg1-positive neurons.C, Immunofluorescent detection of PV-reactive interneurons found on the margin of the CA1 pyramidal cell layer.D, Overlay of C and D with erg1 pseudocolored green. Note that many of the strongly labeled neurons in B are also PV positive (B–D, arrows). E–G, Dual labeling for erg1 and PV in the CA3 hippocampal subfield.E, Erg1 expression is found in the pyramidal cell layer and stratum radiatum. F, PV immunoreactive interneurons in the CA3 (arrows). G, Overlay ofE and F with erg1 pseudocoloredgreen. Note less erg1 expression in the CA3 pyramidal cell layer as compared with the CA1 (compare green cells in D and G). Similar to the CA1, several PV-positive neurons also expressed erg1 (E–G,arrows). However, not all erg1-positive neurons located outside the pyramidal cell layer were PV positive (E,G, arrowheads). H–N, ISH using erg3 antisense probe. H, Erg3 expression was very strong and concentrated on the CA1 hippocampal subfield.I–N, Dual labeling of erg3 transcripts and PV-immunoreactive interneurons in the CA1. I, Erg3 expression was located within the pyramidal cell layer of the CA1, but not in scattered cells located outside as observed using erg1 probe (compare B and I).J, Immunolocalization of PV+ interneurons located along the CA1 pyramidal cell layer. K, Overlay ofI and J with erg3 pseudocoloredgreen. L–M, High magnification ofI–K, respectively, showing that erg3 labeling does not colocalize with PV (arrows). Scale bar (shown inN): A, 1000 μm;B–G, I–K, 100 μm;H, 810 μm; L–N, 50 μm.
Fig. 7.
Fig. 7.
Erg1 is located in a population of parvalbumin-containing interneurons in the cingulate cortex, whereas erg3 is found only in excitatory neurons in the cerebral cortex.A, Relatively strong erg1 expression was found within neurons of the cingulate cortex. B–D, Identification of a population of erg1-positive interneurons in the cingulate cortex by dual labeling with PV. B, High-power bright-field image of erg1-positive neurons from A. Note that erg1-positive neurons are scattered and strongly labeled. C, Immunofluorescent detection of PV-containing interneurons.D, Overlay of B and C with erg1 signals pseudocolored green. Note that nearly all PV-positive neurons are also expressing erg1 transcripts. Characteristic labeling of interneurons by ISH, revealing a bipolar shape, is evident in bright field (arrows).E–H, Unlike erg1, erg3 expression is not found in inhibitory neurons of the cortex. E, Low-power bright-field image showing erg3 expression in cortical layers II/III.F, High-magnification bright-field image of erg3-positive cells in cortical layer III. G, Immunodetection of GAD-immunoreactive interneurons. H, Overlay of F and G with erg3 signals pseudocolored green. Note that GAD-positive cells do not express erg3 (F, arrows point to unlabeled GAD+ cells). Scale bar (shown in H):A, E, 500 μm; B–D,E–H, 50 μm.
Fig. 8.
Fig. 8.
Erg1 transcripts are located in a few scattered PV-positive cells in the caudate/putamen but do not colocalize with PV or Cb in the olfactory bulb. A–D, Erg1 transcripts are located in PV-positive interneurons of the caudate/putamen (CPu). A, Low-magnification bright-field image of erg1-expressing cells in the CPu. Note that cells are strongly labeled but scattered and few in number. B, Higher magnification image of erg1-positive neurons in the CPu. Fiber tracts appear as light gray (arrowhead).C, Immunofluorescent detection of PV-containing neurons.D, Overlay of B and C with erg1 signals pseudocolored green. Note that most PV-positive neurons also express erg1 (B–D,arrows). E–H, Erg1-expressing neurons in the periglomerular layer of the olfactory bulb are not immunoreactive for PV or Cb. E, Low-magnification bright-field image of erg1 in the olfactory bulb. F, High magnification of E (arrow) showing three glomeruli (Gl). Note that erg1 expression is strong and located in large neurons within the periglomerular layer (arrows). G, Immunofluorescent detection of PV- and Cb-positive periglomerular neurons (PV and Cb monoclonal antibodies were mixed and detected with the same secondary antibody).H, Overlay of F and G with erg1 labeling pseudocolored green. Note that none of the large erg1-positive neurons are PV or Cb positive. Scale bar (shown inH): A, 250 μm; E, 500 μm; B–D, F–H, 100 μm.
Fig. 9.
Fig. 9.
Elk2 and elk3 expression in rat brain have overlapping expression in the cerebral cortex and hippocampus.A–B, Dual labeling of elk2 and PV in rat cerebellar cortex. A, Bright-field image showing elk2 expression localized to the granule cell layer (Gr) of the cerebellum. B, Immunofluorescent detection of PV-labeled Purkinje neurons within the Purkinje layer (PL) and inhibitory cells within the molecular layer (ML). Comparison of A and B shows that elk2 is not expressed within the Purkinje cell layer as demarcated by PV staining. C–D, Low- and high-magnification bright-field images, respectively, showing no elk3 expression within the cerebellar cortex. E–F, Low- and high-magnification bright-field images, respectively, showing strong elk2 expression in the olfactory bulb. Elk2 was abundant in the internal granule (IGr) and mitral cell (Mi) layers but not within the periglomerular area (Gl).G–H, Elk3 expression in the caudate/putamen (CPu). G, Low-magnification image showing elk3-positive neurons in the CPu. H, Higher magnification of G showing that most neurons in the CPu were elk3 positive (as compared with erg1) (Fig.8A,B). I–J, Localization of elk2 and elk3 transcripts, respectively, in the hippocampus. Note that both genes were found in the CA1 subfield and the DG, with elk3 expression being weaker than that of elk2.K–L, Elk2 expression in the cerebral cortex.K, Low-power bright-field image showing weak elk2 expression throughout all the cortical lamina with higher levels in upper layers II/III. L, High-power image ofK showing cortical layer II. Note large number of weakly stained neurons. M–N, Elk3 expression in cerebral cortex. M, Similar to elk2, elk3 expression was found throughout the cortex with higher levels within upper lamina.N, High-power image of M showing elk3 in a large proportion of layer II neurons. Scale bar (shown inN): A, B,D, F, H, L,N, 200 μm; I,J, 550 μm; G, 2000 μm;C, E, K, M, 500 μm.
Fig. 10.
Fig. 10.
Kcnq2 and Kcnq3 mRNA transcripts overlap in the hippocampus and caudate/putamen, but not the cerebellum.A–B, Comparison of Kcnq2 and Kcnq3 transcripts in the hippocampus. A, Abundant Kcnq2 expression was detected in CA1–CA3 pyramidal cells and granule cells of the DG.B, Strong Kcnq3 expression was found in similar neurons but was weaker than Kcnq2 in CA2. C–G, Kcnq3 and Kcnq2 expression in the caudate/putamen (CPu).C, Low-magnification bright-field image showing strong Kcnq3 expression in the large majority of CPu neurons.D–F, Kcnq3 is not expressed in PV-immunoreactive neurons in the CPu. D, High-magnification bright-field image of Kcnq3-positive neurons in the CPu. E, Immunofluorescent detection of PV-containing neurons in same section asD. F, Overlay of D and Ewith Kcnq3 pseudocolored green. Note that no PV neurons were Kcnq3 positive (arrows). G, Kcnq2 is also located in the caudate/putamen. H–K, Kcnq2, but not Kcnq3, is expressed in the cerebellar cortex. H, Low-magnification image of Kcnq2 (left) and Kcnq3 (right) expression in the cerebellar cortex.I–K, Kcnq2 is located in the granule and Purkinje cell layer of the cerebellum. I, High-power bright-field image showing Kcnq2 expression in the cells of the Purkinje layer (PL) and granule layer (Gr) but not the molecular layer (ML). J, Same image asI, with immunodetection of PV-reactive Purkinje cells and interneurons of the molecular layer. K, Overlay of I and J, with Kcnq2 pseudocoloredgreen. Scale bar (shown in K):A, B, 275 μm; C, 250 μm; D–F, 100 μm;G, 300 μm; H, 475 μm;I–K, 50 μm.
Fig. 11.
Fig. 11.
Differential distributions of Kcnq2 and Kcnq3 transcripts in rat cerebral cortex. A, Cross section of rat cerebral cortex showing strong Kcnq2-positive neurons in layers II/III and V, and little or no signal in layer IV.B, High-power bright-field image showing layer II/III Kcnq2-positive neurons. C, Same image asB, with immunodetection of PV-reactive interneurons.D, Overlay of B–D with Kcnq2 pseudocolored green. Note that some Kcnq2 transcripts colocalize with PV-positive interneurons (B–D,arrows), and some do not (B–D,arrowheads). E, High-power bright-field image showing strong Kcnq2 signal in a large layer V pyramidal neuron.F, Same image as E, with immunodetection of PV-reactive interneurons. G, Overlay ofE and F with Kcnq2 pseudocoloredgreen. Note that most Kcnq2 transcripts did not colocalize with PV-positive interneurons (E,arrows). H, ISH for Kcnq3 showing labeling of neurons in cortical layers II–VI, with highest levels found in layer IV. I–N, Kcnq3 expression is not found in PV-positive cortical interneurons in cortical layer IV (IK) or V (LN). I, High-power image of Kcnq3-labeled neurons in cortical layer IV.J, Immunofluorescent detection of PV in I. K, Overlay of I and J with Kcnq3 pseudocolored green. L, High-power image of Kcnq3-labeled neurons in cortical layer V. M, Immunofluorescent detection of PV in L. N, Overlay of L and M with Kcnq3 pseudocoloredgreen. Arrows in I andL point to Kcnq3-negative cells that were immunoreactive for PV. Scale bar (shown in N): A,H, 200 μm; BG,IN, 50 μm.
Fig. 12.
Fig. 12.
Erg1, Kcnq2, and Kcnq3 mRNA expression was often overlapping in the rat midbrain and hindbrain.3, Oculomotor nucleus; 7, facial nucleus;12, hypoglossal nucleus; Cu, cuneate nucleus; DC, dorsal cochlear nucleus; IC, inferior colliculus; IO, inferior olive;LDT, laterodorsal tegmental nucleus; LRt, lateral reticular nucleus; MG, medial geniculate nucleus; MVe, medial vestibular nucleus;Pn, pontine nucleus; RdN, red nucleus;SN, substantia nigra; Sp5, spinal trigeminal nucleus; VLL, ventral nucleus lateral lemniscus; VTg, ventral tegmental nucleus.

References

    1. Abbott GW, Sesti F, Splawski I, Buck ME, Lehmann MH, Timothy KW, Keating MT, Goldstein SA. MiRP1 forms IKr potassium channels with HERG and is associated with cardiac arrhythmia. Cell. 1999;97:175–187. - PubMed
    1. Baxter DA, Byrne JH. Ionic conductance mechanisms contributing to the electrophysiological properties of neurons. Curr Opin Neurobiol. 1991;1:105–112. - PubMed
    1. Bijlenga P, Occhiodoro T, Liu JH, Bader CR, Bernheim L, Fischer-Lougheed J. An ether-a-go-go K+ current, Ih-eag, contributes to the hyperpolarization of human fusion-competent myoblasts. J Physiol (Lond) 1998;512:317–323. - PMC - PubMed
    1. Brown DA. M channels. In: Narahashi ET, editor. Ion channels. Plenum; New York: 1988. pp. 55–94. - PubMed
    1. Brown DA, Adams PR. Muscarinic suppression of a novel voltage-sensitive K+ current in a vertebrate neurone. Nature. 1980;283:673–676. - PubMed

Publication types

MeSH terms