. 2001 Jun;87(3):626-37.
doi: 10.1645/0022-3395(2001)087[0626:PMBSD]2.0.CO;2.

Plasmodium malariae blood-stage dynamics

Affiliations

Plasmodium malariae blood-stage dynamics

F E McKenzie et al. J Parasitol. 2001 Jun.

Abstract

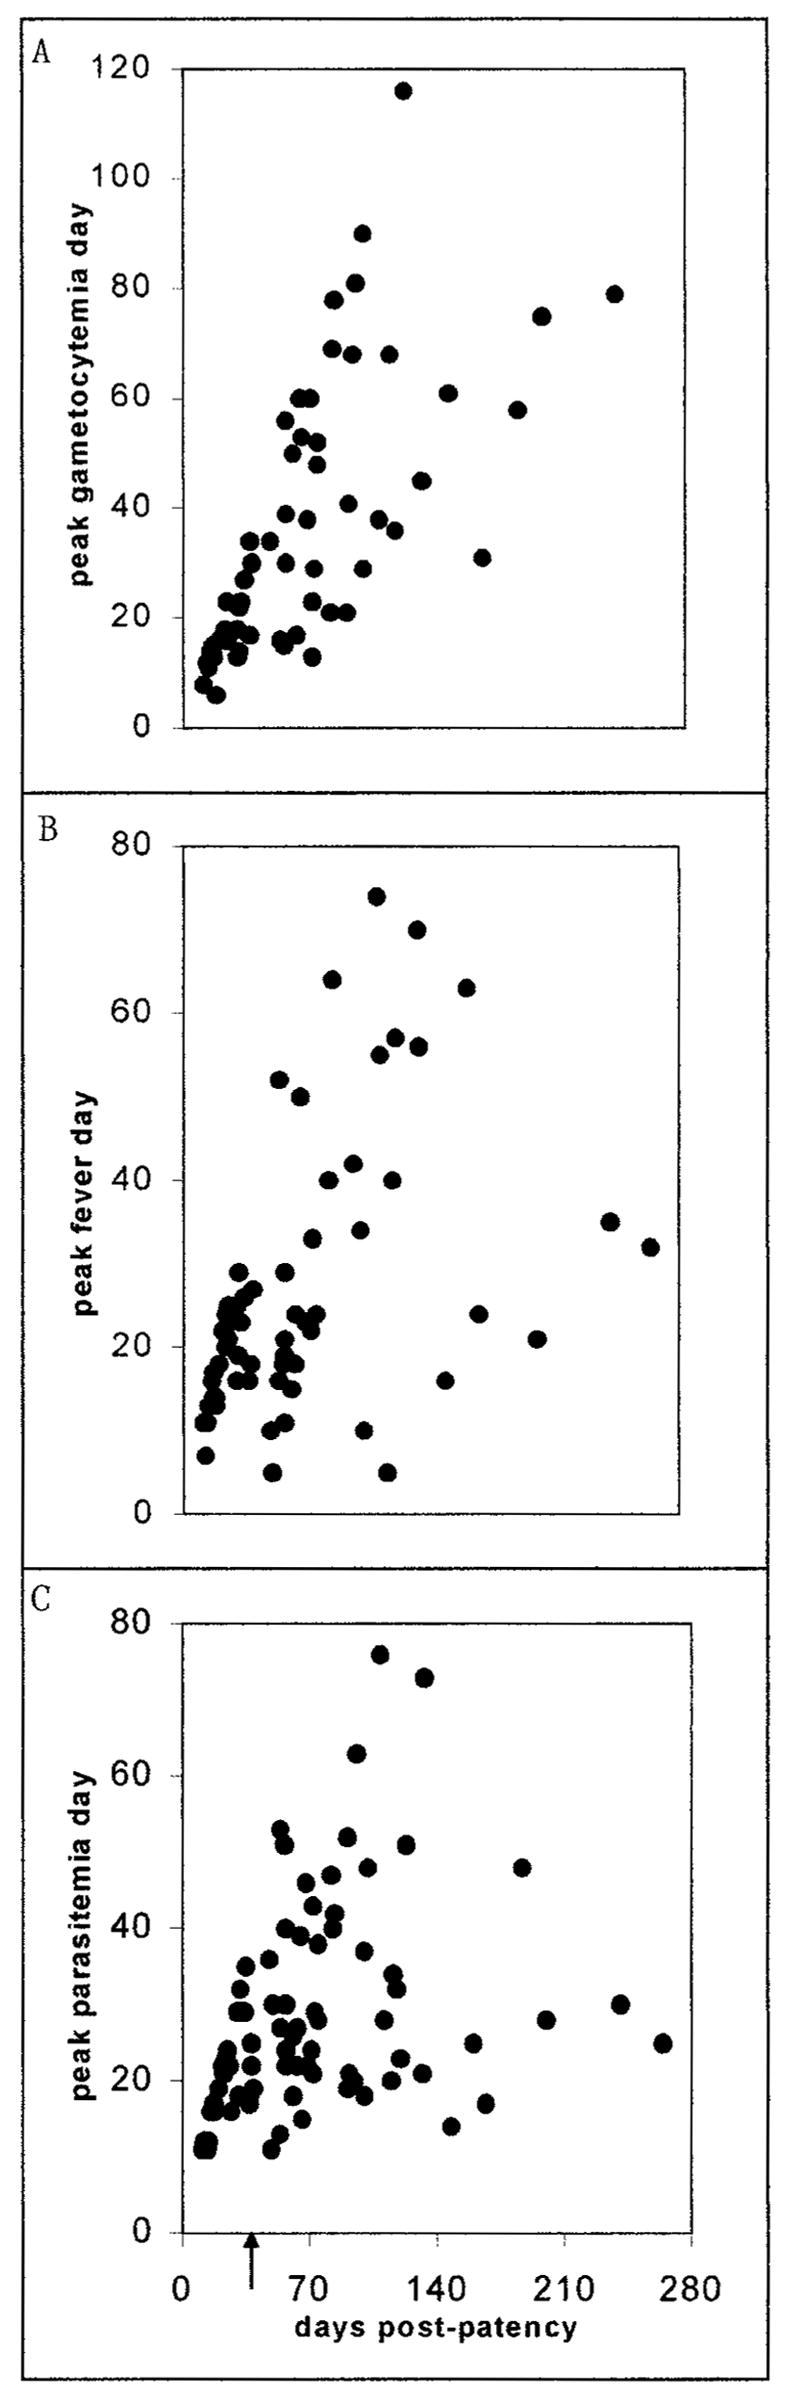
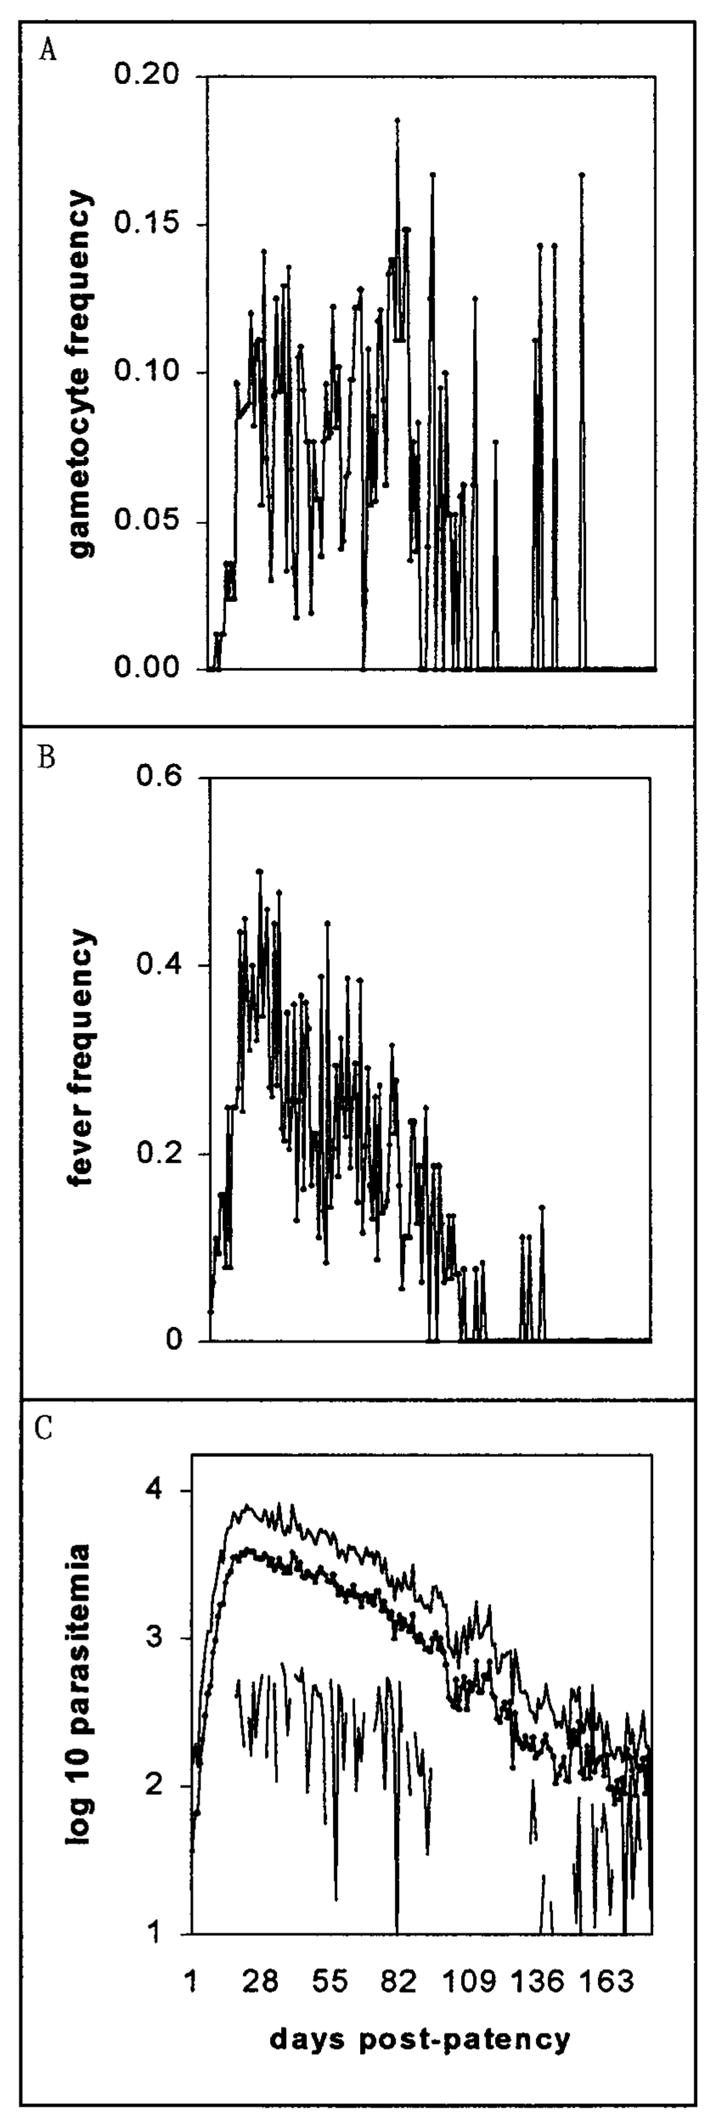
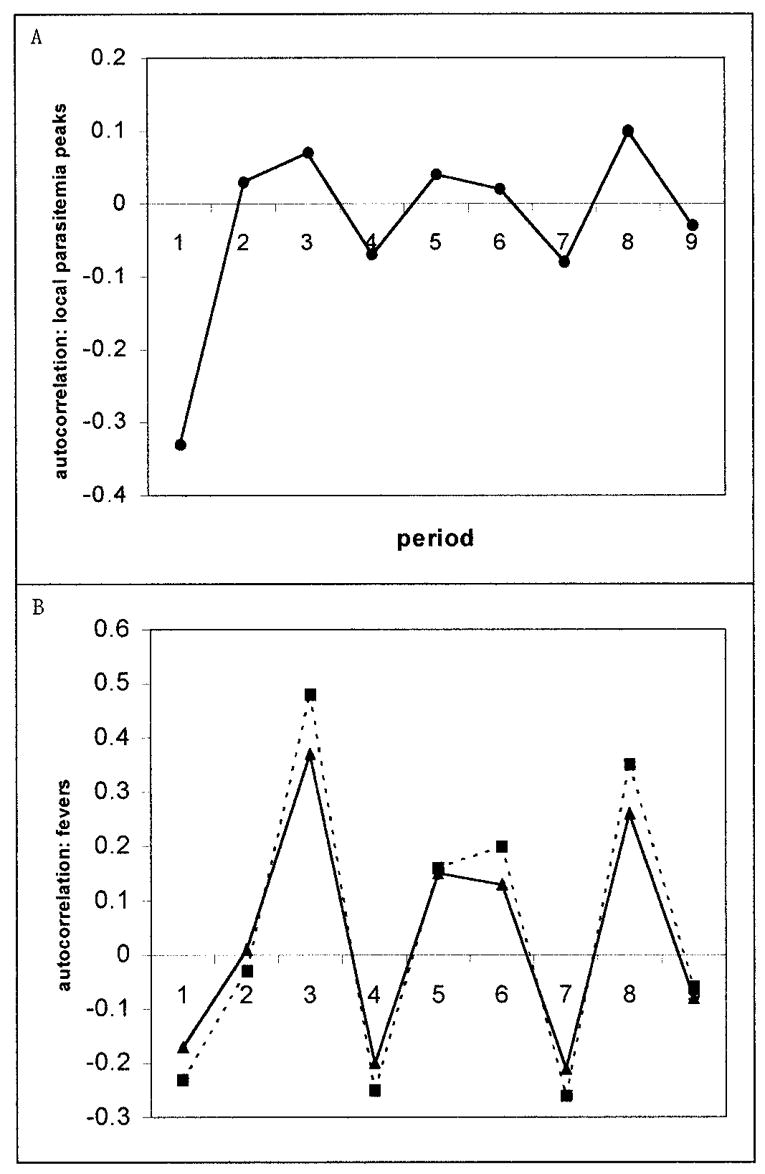
We examine the dynamics of parasitemia, fever, and gametocytemia reflected in the preintervention charts of 180 malaria-naive U.S. neurosyphilis patients infected with the USPHS strain of Plasmodium malariae, for malariatherapy, focusing on the 84 charts for which more than 35 days of patency preceded intervention and daily records encompassed 92% or more of the duration of each infection. Inoculum size did not influence any outcome variable. Fevers (days with temperatures > or =101 F) followed patterns that fit recognized brood structures more often than did our approximations of merogony cycles (via local peaks in parasitemia), but neither closely fit textbook quartan patterns. There were no discernable patterns in gametocytemia. Successful transmission to mosquitoes increased following subcurative drug treatment but did not depend on detectable gametocytemia.


Figures

Figure 1
Figure 1
Plots, for the 96 patient charts from 1950 to 1958, of the day of patent infection on which the peak gametocyte density (A), peak fever (B), and peak asexual-form density (C), occurred. The arrow indicates day 35 of patency (see text).
Figure 2
Figure 2
Patent gametocyte frequency (A; binary, in all 84 charts), fever frequency (B; binary, in the 64 charts with fever records), and asexual-form density (C; as the mean of the log 10 parasitemia, in all 84 charts), for each day of patent, preintervention infection in the 1950s charts with more than 35 days of observed preintervention patency.
Figure 3
Figure 3
Examples of 1950–1958 charts with more than 35 days of preintervention patency. For each chart, the bar graph shows fevers (as F − 100), the line graph log 10 parasitemia (as circles) and gametocytemia (as diamonds) per cubic millimeter of blood, plotted from the first day of patent parasitemia to the last day prior to intervention. Patient identification numbers and days plotted are: (A) S-1175, 132 days; (B) S-1078, 38 days; (C) S-1109, 114 days; (D) S-1054, 48 days; (E) S-1290, 108 days; (F) S-1215, 55 days; (G) S-1268, 65 days; (H) S-1223, 62 days; (I) S-1277, 199 days; (J) S-1052, 196 days. Single quartan intervals between local peaks in parasitemia are most evident in parts A (days 70–82 and 84–90) and H (days 34–40 and 42–48). Single quartan intervals between fevers (i.e., days ≥101 F) are most evident in parts A (days 4–13, 39–51, 53–59, 72–78, and 83–89) and G (days 20–29, 31–37, 39–45, 47–56, 58–64). The patient in part J was treated with 1 g of terramycin daily on days 38–41 and reinoculated with USPHS P. malariae on day 72.
Figure 3
Figure 3
Examples of 1950–1958 charts with more than 35 days of preintervention patency. For each chart, the bar graph shows fevers (as F − 100), the line graph log 10 parasitemia (as circles) and gametocytemia (as diamonds) per cubic millimeter of blood, plotted from the first day of patent parasitemia to the last day prior to intervention. Patient identification numbers and days plotted are: (A) S-1175, 132 days; (B) S-1078, 38 days; (C) S-1109, 114 days; (D) S-1054, 48 days; (E) S-1290, 108 days; (F) S-1215, 55 days; (G) S-1268, 65 days; (H) S-1223, 62 days; (I) S-1277, 199 days; (J) S-1052, 196 days. Single quartan intervals between local peaks in parasitemia are most evident in parts A (days 70–82 and 84–90) and H (days 34–40 and 42–48). Single quartan intervals between fevers (i.e., days ≥101 F) are most evident in parts A (days 4–13, 39–51, 53–59, 72–78, and 83–89) and G (days 20–29, 31–37, 39–45, 47–56, 58–64). The patient in part J was treated with 1 g of terramycin daily on days 38–41 and reinoculated with USPHS P. malariae on day 72.
Figure 4
Figure 4
The duration of prepatency (A) and density of the first patent parasitemia (B) plotted against the log 10 inoculum size in the 80 (of the 84 total with more than 35 days of preintervention patency) 1950s patient charts for which this information was available.
Figure 5
Figure 5
The correlograms of local peaks in parasitemia (A; binary) and fevers (B; binary as solid line, binned as dotted line) in the 77 and 56 patient charts from the 1950s, respectively, with 4 or more fevers or local peaks.

References

    1. Basu BC. The frequency of distribution of gametocytes of the Indian strains of malaria parasites. Indian Journal of Malariology. 1947;1:123–127.
    1. Becker FT. Induced malaria as a therapeutic agent. In: Boyd MF, editor. Malariology. W. B. Saunders; Philadelphia, Pennsylvania: 1949. pp. 1145–1157.
    1. Boudin C, Olivier M, Molez JF, Chiron JP, Ambroise-Thomas P. High human malarial infectivity to laboratory-bred Anopheles gambiae in a village in Burkina Faso. American Journal of Tropical Medicine and Hygiene. 1993;48:700–706. - PubMed
    1. Boyd MF. Observations of naturally and artificially induced quartan malaria. American Journal of Tropical Medicine. 1940;20:749–798.
    1. Boyd MF, Stratman-Thomas WK. A note on the transmission of quartan malaria by Anopheles quadrimaculatus. American Journal of Tropical Medicine. 1933;13:265–271.

Publication types