Review
. 2001 Jul;81(3):1305-52.
doi: 10.1152/physrev.2001.81.3.1305.

Mechanics of the mammalian cochlea

Affiliations
Review

Mechanics of the mammalian cochlea

L Robles et al. Physiol Rev. 2001 Jul.

Abstract

In mammals, environmental sounds stimulate the auditory receptor, the cochlea, via vibrations of the stapes, the innermost of the middle ear ossicles. These vibrations produce displacement waves that travel on the elongated and spirally wound basilar membrane (BM). As they travel, waves grow in amplitude, reaching a maximum and then dying out. The location of maximum BM motion is a function of stimulus frequency, with high-frequency waves being localized to the "base" of the cochlea (near the stapes) and low-frequency waves approaching the "apex" of the cochlea. Thus each cochlear site has a characteristic frequency (CF), to which it responds maximally. BM vibrations produce motion of hair cell stereocilia, which gates stereociliar transduction channels leading to the generation of hair cell receptor potentials and the excitation of afferent auditory nerve fibers. At the base of the cochlea, BM motion exhibits a CF-specific and level-dependent compressive nonlinearity such that responses to low-level, near-CF stimuli are sensitive and sharply frequency-tuned and responses to intense stimuli are insensitive and poorly tuned. The high sensitivity and sharp-frequency tuning, as well as compression and other nonlinearities (two-tone suppression and intermodulation distortion), are highly labile, indicating the presence in normal cochleae of a positive feedback from the organ of Corti, the "cochlear amplifier." This mechanism involves forces generated by the outer hair cells and controlled, directly or indirectly, by their transduction currents. At the apex of the cochlea, nonlinearities appear to be less prominent than at the base, perhaps implying that the cochlear amplifier plays a lesser role in determining apical mechanical responses to sound. Whether at the base or the apex, the properties of BM vibration adequately account for most frequency-specific properties of the responses to sound of auditory nerve fibers.


Figures
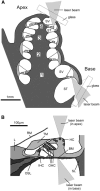
Fig. 1
Fig. 1
Sites of measurement of mechanical vibrations in mammalian cochleae. A: a schematic cross section of the guinea pig cochlea, indicating approaches to basilar membrane (BM) locations at the cochlear base, via an opening into scala tympani (ST), and to structures at the cochlear apex, via an opening into scala vestibuli (SV). The recording sites are also indicated in B, a diagram of the organ of Corti, the BM, and the TM. The numbers in A indicate the four cochlear turns. HC, Hensen's cells; IHC, inner hair cell; L, spiral limbus; OHC, outer hair cells; OSL, osseous spiral lamina; RM, Reissner's membrane; SL, spiral ligament; TM, tectorial membrane. [From Cooper (44), with permission from Elsevier Science.]
Fig. 2
Fig. 2
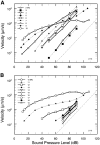
Velocity-intensity functions of BM responses to tones. A : responses to tones with frequency equal to and lower than characteristic frequency (CF; 10 kHz). B : responses to tones with frequency equal to and higher than CF. The straight dotted lines (bottom right in each panel) have linear slopes (1 dB/dB). Recordings were made at a site of chinchilla cochlea situated some 3.5 mm from its basal end. [From Ruggero et al. (326). Copyright, Acoustical Society of America, 1997.]
Fig. 3
Fig. 3
Displacement-intensity functions for BM responses to CF tones recorded at basal cochlear sites in chinchilla, guinea pig, and cat. For comparison, the dotted line indicates linear growth. [Chinchilla data (squares) from Ruggero et al. (326); guinea pig data (solid and open circles) from Nuttal and Dolan (259) and Cooper (43), respectively; cat data (diamonds) from Cooper and Rhode (47).]
Fig. 4
Fig. 4
A family of isointensity curves representing the velocity of BM responses to tones as a function of frequency (abscissa) and intensity (parameter, in dB SPL). The isointensity curves represent the same chinchilla data of Fig. 2. [From Ruggero et al. (326). Copyright, Acoustical Society of America, 1997.]
Fig. 5
Fig. 5
Families of isointensity curves representing the sensitivity (displacement divided by stimulus pressure) of BM responses to tones as a function of frequency (abscissa) and intensity (parameter, in dB SPL). The lower CF (10 kHz) data were recorded at the 3.5-mm site of the chinchilla cochlea. [Redrawn from Ruggero et al. (326).] The higher CF (17 kHz) data are from a basal site of the guinea pig cochlea. [Redrawn from Cooper and Rhode (52).]
Fig. 6
Fig. 6
Maximum gains of BM or TM responses, relative to middle-ear vibration, from basal and apical cochlear sites. Basal BM responses to low-level tones have been normalized to responses of the incus (guinea pig and cat) or the stapes (chinchilla). The TM data for the chinchilla apex, normalized to the vibrations of the umbo of the tympanic membrane, were selected to indicate the range of sensitivities. Chinchilla base (circles): CF = 8.4 kHz, data from Ruggero et al. (328); chinchilla apex (dashed lines): CF = 0.35–0.5 kHz, data from Rhode and Cooper (299); guinea pig (squares): CF =17 kHz, data from Sellick et al. (360); cat (triangles): CF = 30 kHz, data from Cooper and Rhode (47).
Fig. 7
Fig. 7
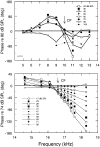
The phases of BM responses to tones as a function of frequency. The phases of BM displacement toward scala tympani are expressed relative to inward ossicular displacement. The data were obtained at basal sites of the cochleae of squirrel monkey, chinchilla, guinea pig, and cat. CFs are indicated by closed symbols. Guinea pig (diamonds): data from Nuttall and Dolan (259); guinea pig (circles): data from Sellick et al. (360); chinchilla (X): CF = 9.7 kHz, data from Ruggero et al. (326); chinchilla (crosses): CF = 15 kHz, data from Narayan et al. (243); squirrel monkey (squares): data from Rhode (293); cat (triangles): data from Cooper and Rhode (47).
Fig. 8
Fig. 8
Intensity dependence of BM response phases around CF. BM phases in chinchilla (top) or guinea pig (bottom) are expressed relative to the phases of responses at a single stimulus intensity. Chinchilla data were normalized to 80 dB SPL and were from Ruggero et al. (326). Guinea pig data were normalized to 74 dB SPL and were from Nuttall and Dolan (258).
Fig. 9
Fig. 9
BM responses to rarefaction clicks. The response waveforms, recorded at a basal site of the chinchilla cochlea, are displayed with a uniform scale of sensitivity (velocity per unit pressure). The thin vertical line indicates the onset of vibration of the middle-ear ossicles. Positive values indicate velocity toward scala vestibuli. Peak stimulus pressures (in dB/20 μPa) are indicated above each trace. [Data from Recio et al. (290).]
Fig. 10
Fig. 10
BM responses to clicks and tones recorded at the same site in a chinchilla cochlea. Frequency spectra of BM responses to clicks (dashed and solid lines; peak pressures 24–104 dB) compared with the magnitudes of responses to tones (symbols). The thick solid line indicates the spectrum of responses to 104-dB clicks recorded 10–20 min postmortem. [Adapted from Recio et al. (290).]
Fig. 11
Fig. 11
Sensitivity (displacement divided by stimulus pressure) of responses to tones at the apex of guinea pig and chinchilla cochleae. Open symbols: chinchilla TM (CF = 500 Hz), data from Cooper and Rhode (52); solid symbols: guinea pig organ of Corti (CF = 400 Hz), data replotted from Zinn et al. (413); thick continuous line (no symbols): guinea pig BM (CF ∼300 Hz), data replotted from Cooper and Rhode (49); thin lines (no symbols): responses to tones at three intensities spaced 10 dB apart, guinea pig organ of Corti (CF ∼300 Hz), data replotted from Khanna and Hao (178).
Fig. 12
Fig. 12
Vibration phases at the tectorial membrane (TM) of the cochleae of chinchilla and guinea pig. Displacements toward scala tympani (for the “slow” traveling wave) are shown relative to inward displacement of the middle ear ossicles. CFs are indicated by closed symbols. Solid line: chinchilla, at a site ∼14 mm from base (CF ∼500 Hz); reference, umbo. Dashed line: guinea pig, at a site ∼16.5 mm from base (CF ∼400 Hz); reference, incus. [Data from Cooper (42).]
Fig. 13
Fig. 13
Comparison of vibration sensitivity (velocity per unit pressure) at the base and apex of the chinchilla cochlea. For each family of curves, stimulus frequencies are shown normalized to CF (500 Hz and 9 kHz). At either site, sensitivity decreases as function of stimulus level. At the base of the cochlea, responses to CF tones differ by as much as 56 dB as a function of stimulus level; peak sensitivities at the highest and lowest stimulus levels differ by 48 dB. At the apex, the two measures of the intensity dependence of sensitivity are the same, 15 dB. The upward arrows indicate the frequencies of peak sensitivity (BF) for responses to the highest level tones, which resemble postmortem data. [Basal BM data from Ruggero et al. (326); apical TM data from Cooper and Rhode (52).]
Fig. 14
Fig. 14
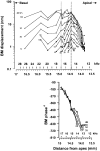
Magnitudes and phases of BM responses to 15-kHz tones as functions of cochlear longitudinal position (expressed in mm from the apex). Data for BM positions apical to the dotted line were obtained from a single guinea pig, whereas data from more basal sites came from four other subjects. [Guinea pig data reprinted from Russell and Nilsen (338). Copyright 1997 National Academy of Sciences, USA.]
Fig. 15
Fig. 15
Pressure magnitudes (A and C) and phases (B and D) near the BM in scala tympani of a gerbil cochlea. The distance from the BM (in μm) is indicated in the legends of B and D. A and B: in vivo data. C and D: data recorded immediately postmortem. The abscissas indicate stimulus frequency. Phases are expressed relative to pressure in scala vestibuli. Stimuli were 80-dB tones. [Replotted from Olson (266). Copyright, Acoustical Society of America, 1998.]
Fig. 16
Fig. 16
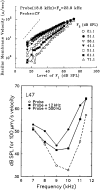
Two-tone suppression at the BM. Top: velocity-intensity functions for BM responses to a near-CF tone (18.8 kHz) presented simultaneously with a 22.9-kHz suppressor tone. The parameter is the intensity of the suppressor tone. [Guinea pig data from Nuttall and Dolan (257).] Bottom: frequency specificity of two-tone suppression. Iso-velocity contours (100 μm/s) are shown for responses to single tones (open circles) and for responses to the same tones in the presence of 500-Hz or 12-kHz suppressors (solid circles and squares, respectively) presented at 70 dB SPL. [Chinchilla data from Ruggero et al. (332).]
Fig. 17
Fig. 17
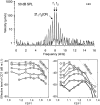
Cubic difference tones in BM vibrations. Top panel: spectrum of responses from a basal BM site to a pair of tones with frequencies slightly higher than CF. The primary tones, each presented at 50 dB SPL, were chosen so that 2f1-f2= CF (7.5 kHz). [Chinchilla data replotted from Robles et al. (312).] Bottom panels: BM magnitude of the (2f1- f2) distortion product as a function of stimulus frequency ratio f2/f1 chosen so that 2f1-f2= CF. Stimulus SPLs are indicated by the circled numbers (e.g., “8” signifies “80 dB SPL”). Left: from an apical site in chinchilla. Right: from a basal site in guinea pig. [From Cooper and Rhode (52).]
Fig. 18
Fig. 18
Frequency tuning in cochlear vibrations and in auditory-nerve fibers in chinchilla. Curves at right: a frequency-threshold tuning curve for an auditory-nerve fiber (solid line) is compared with isoresponse curves for a BM site with identical CF (9.5 kHz) recorded in the same ear (244). At the fiber's CF threshold (13 dB SPL), BM vibrations had a peak displacement of 2.7 nm or, equivalently, 164 μm/s. These values were used to plot BM isodisplacement and isovelocity tuning curves (dotted and dashed lines, respectively). [A better mechanical/ neural match was obtained by high-pass filtering the BM displacement curve at a rate of 3.8 dB/octave (not shown).] Curves at left isodisplacement and isovelocity tuning curves (1-nm and 2.5-μm/s, respectively; dotted and dashed lines) for TM vibrations recorded at an apical cochlear site (299) are compared with a neural tuning curve (solid line), the average of recordings from many auditory-nerve fibers (A. N. Temchin, N. C. Rich, and M. A. Ruggero, unpublished observations).
Fig. 19
Fig. 19
The effect of death on the magnitudes and phases of BM responses to tones. The response magnitudes are expressed as tuning curves, in terms of the stapes velocity required for a constant BM velocity of 50 μm/s. The phases are given relative to stapes vibrations. The arrowhead indicates the high-frequency phase plateau (see sect. iiA5). Postmortem data were measured within 1 h after death of the animal. [Guinea pig data replotted from Nuttall and Dolan (259).]
Fig. 20
Fig. 20
The effects of furosemide on BM responses. Frequency spectra of BM responses to 75-dB (peak SPL) clicks measured in two cochleae, before (solid line) and after (dashed lines) intravenous furosemide injections. The panels show magnitudes and phases, computed by Fourier transformation. [Chinchilla data from Ruggero and Rich (322).]

References

    1. Abbas PJ. Effects of stimulus frequency on two-tone suppression: a comparison of physiological and psychophysical results. J Acoust Soc Am. 1978;63:1878–1886. - PubMed
    1. Abbas PJ, Sachs MB. Two-tone suppression in auditory-nerve fibers: extension of a stimulus-response relationship. J Acoust Soc Am. 1976;59:112–122. - PubMed
    1. Allen JB. Two-dimensional cochlear fluid model: new results. J Acoust Soc Am. 1977;61:110–119. - PubMed
    1. Allen JB. Cochlear micromechanics—a physical model of transduction. J Acoust Soc Am. 1980;68:1660–1670. - PubMed
    1. Allen JB, Fahey PF. A second cochlear-frequency map that correlates distortion product and neural tuning measurements. J Acoust Soc Am. 1993;94:809–816. - PubMed

Publication types