

Visual responses of ganglion cells of a New-World primate, the capuchin monkey, Cebus apella
- PMID: 11432364
- PMCID: PMC2270155
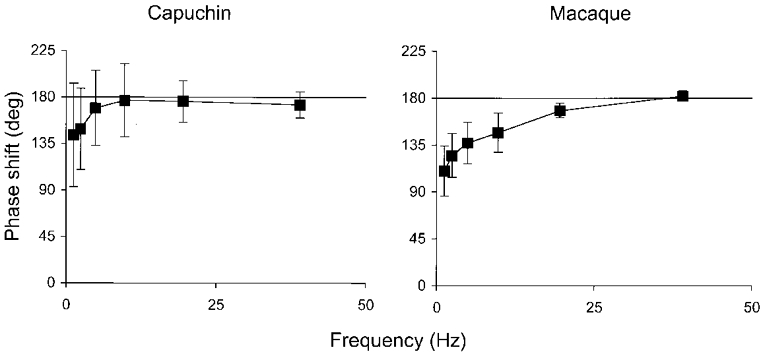
- DOI: 10.1111/j.1469-7793.2000.00573.x
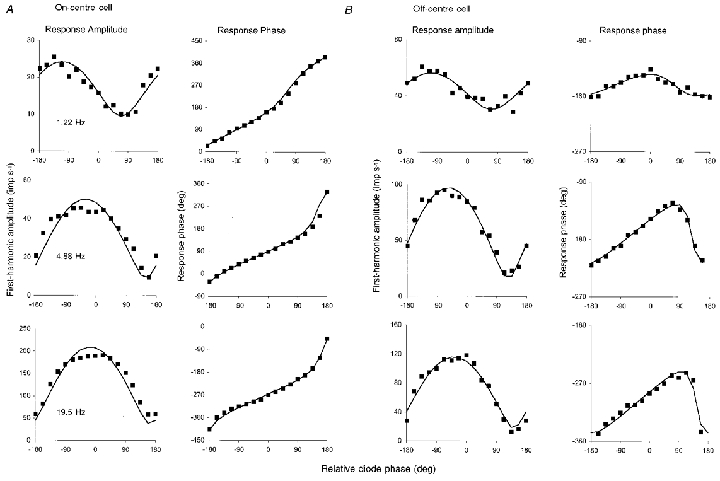
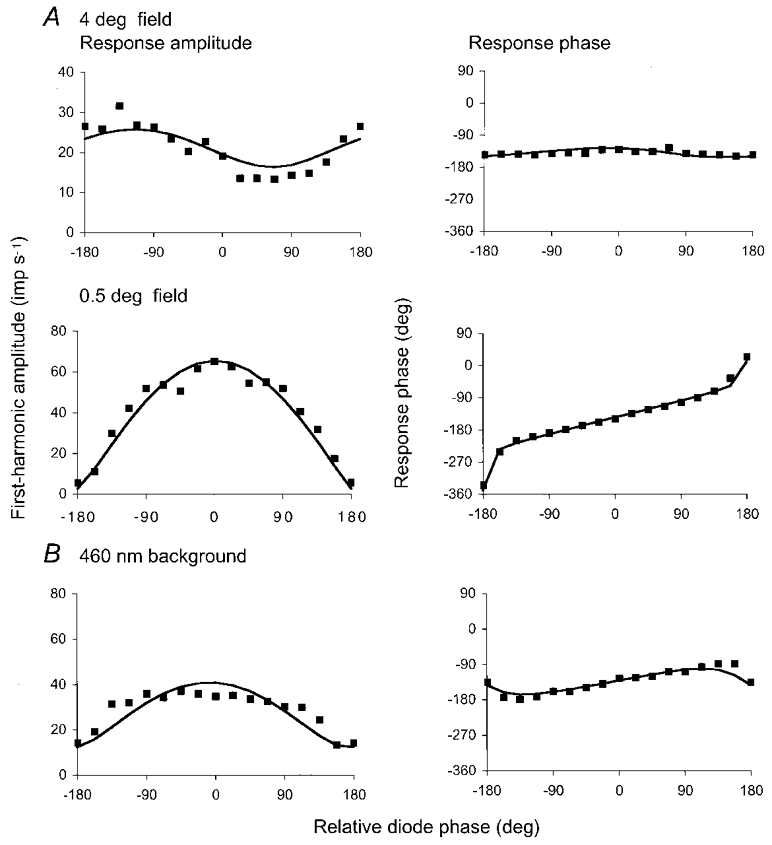
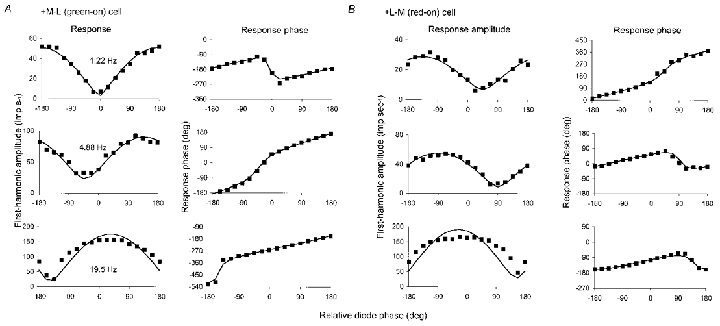
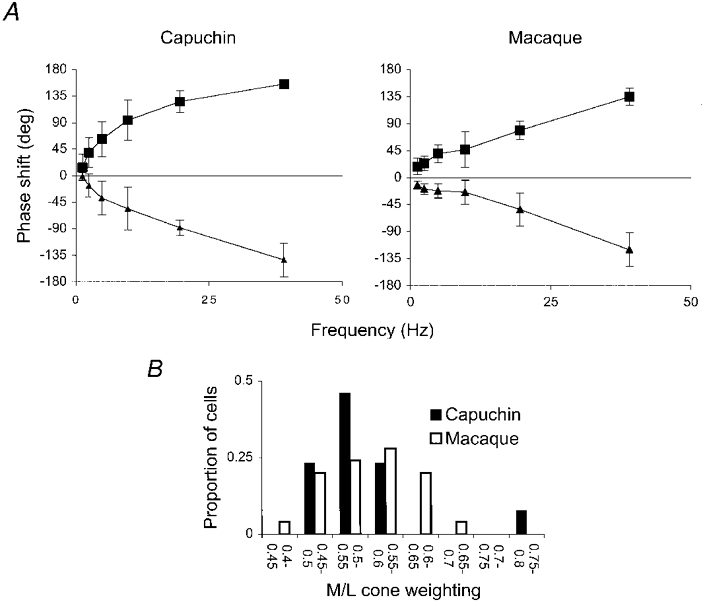
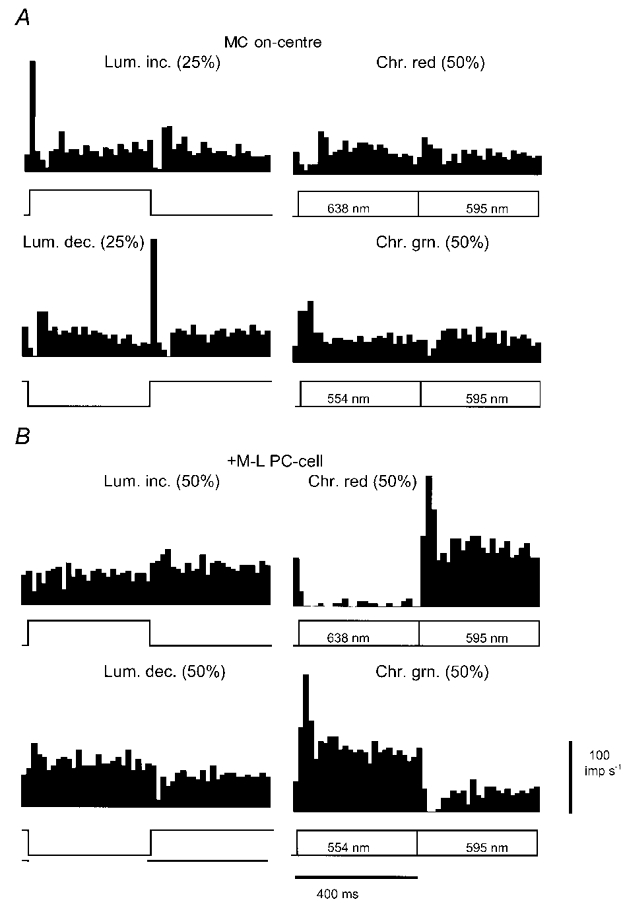
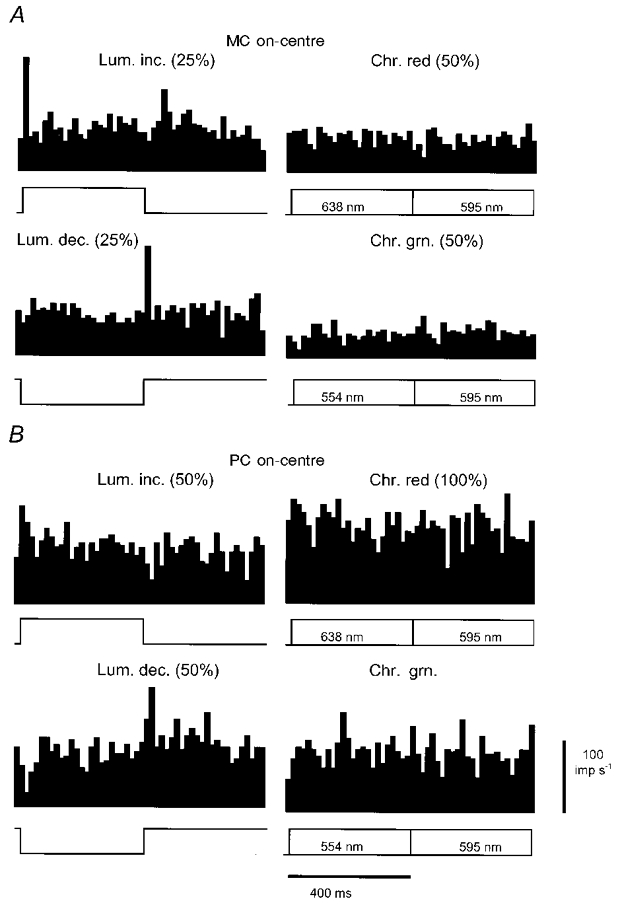
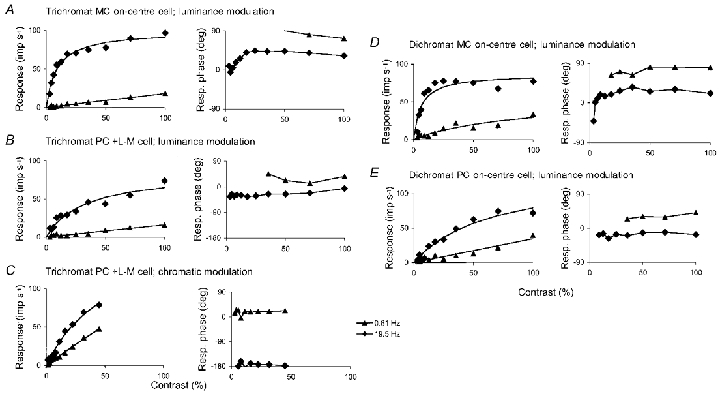
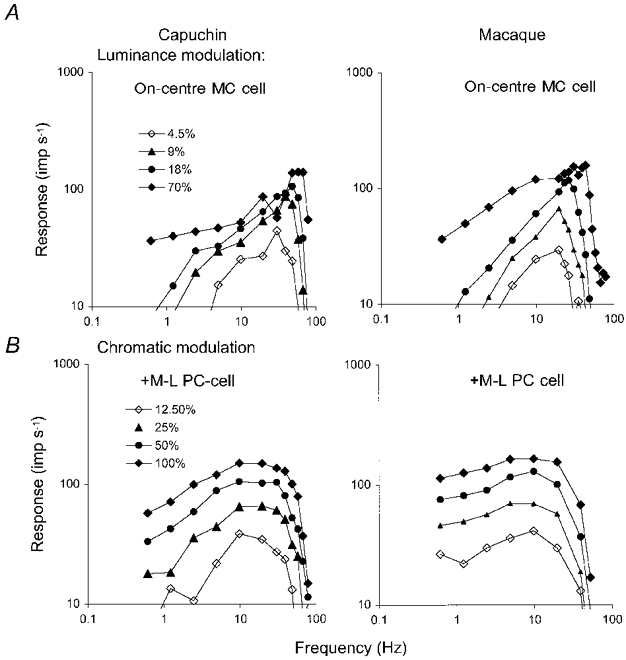
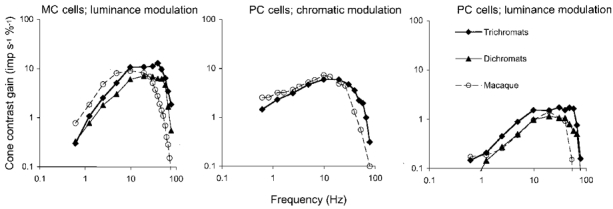
Visual responses of ganglion cells of a New-World primate, the capuchin monkey, Cebus apella
Abstract
1. The genetic basis of colour vision in New-World primates differs from that in humans and other Old-World primates. Most New-World primate species show a polymorphism; all males are dichromats and most females trichromats. 2. In the retina of Old-World primates such as the macaque, the physiological correlates of trichromacy are well established. Comparison of the retinae in New- and Old-World species may help constrain hypotheses as to the evolution of colour vision and the pathways associated with it. 3. Ganglion cell behaviour was recorded from trichromatic and dichromatic members of a New-World species (the capuchin monkey, Cebus apella) and compared with macaque data. Despite some differences in quantitative detail (such as a temporal response extended to higher frequencies), results from trichromatic animals strongly resembled those from the macaque. 4. In particular, cells of the parvocellular (PC) pathway showed characteristic frequency-dependent changes in responsivity to luminance and chromatic modulation, cells of the magnocellular (MC) pathway showed frequency-doubled responses to chromatic modulation, and the surround of MC cells received a chromatic input revealed on changing the phase of heterochromatically modulated lights. 5. Ganglion cells of dichromats were colour-blind versions of those of trichromats. 6. This strong physiological homology is consistent with a common origin of trichromacy in New- and Old-World monkeys; in the New-World primate the presence of two pigments in the middle-to-long wavelength range permits full expression of the retinal mechanisms of trichromatic vision.
Figures
Similar articles
-
Alouatta trichromatic color vision: cone spectra and physiological responses studied with microspectrophotometry and single unit retinal electrophysiology.PLoS One. 2014 Nov 18;9(11):e113321. doi: 10.1371/journal.pone.0113321. eCollection 2014. PLoS One. 2014. PMID: 25405863 Free PMC article.
-
Ganglion cells of a short-wavelength-sensitive cone pathway in New World monkeys: morphology and physiology.Vis Neurosci. 1999 Mar-Apr;16(2):333-43. doi: 10.1017/s0952523899162138. Vis Neurosci. 1999. PMID: 10367967
-
Post-receptoral mechanisms of colour vision in New World primates.Vision Res. 1998 Nov;38(21):3329-37. doi: 10.1016/s0042-6989(97)00335-0. Vision Res. 1998. PMID: 9893845
-
Parallel pathways in the retina of Old and New World primates.Rev Bras Biol. 1996 Dec;56 Su 1 Pt 2:323-38. Rev Bras Biol. 1996. PMID: 9394511 Review.
-
Morphology and physiology of primate M- and P-cells.Prog Brain Res. 2004;144:21-46. doi: 10.1016/S0079-6123(03)14402-0. Prog Brain Res. 2004. PMID: 14650838 Review.
Cited by
-
Specificity of M and L cone inputs to receptive fields in the parvocellular pathway: random wiring with functional bias.J Neurosci. 2006 Oct 25;26(43):11148-61. doi: 10.1523/JNEUROSCI.3237-06.2006. J Neurosci. 2006. PMID: 17065455 Free PMC article.
-
Organization of the human trichromatic cone mosaic.J Neurosci. 2005 Oct 19;25(42):9669-79. doi: 10.1523/JNEUROSCI.2414-05.2005. J Neurosci. 2005. PMID: 16237171 Free PMC article.
-
Alouatta trichromatic color vision: cone spectra and physiological responses studied with microspectrophotometry and single unit retinal electrophysiology.PLoS One. 2014 Nov 18;9(11):e113321. doi: 10.1371/journal.pone.0113321. eCollection 2014. PLoS One. 2014. PMID: 25405863 Free PMC article.
-
Nonhuman Primate Model of Oculocutaneous Albinism with TYR and OCA2 Mutations.Research (Wash D C). 2020 Mar 11;2020:1658678. doi: 10.34133/2020/1658678. eCollection 2020. Research (Wash D C). 2020. PMID: 32259106 Free PMC article.
-
Cone photopigment variations in Cebus apella monkeys evidenced by electroretinogram measurements and genetic analysis.Vision Res. 2010 Jan;50(1):99-106. doi: 10.1016/j.visres.2009.10.017. Vision Res. 2010. PMID: 19883678 Free PMC article.
References
-
- Benardete EA, Kaplan E, Knight BW. Contrast gain control in the primate retina: P cells are not X-like, some M cells are. Visual Neuroscience. 1992;8:483–486. - PubMed
-
- Born G, Grützner P, Hemminger H. Evidenz für eine Mosaikstruktur der Netzhaut bei Konduktorinnen für Dichromasie. Human Genetics. 1976;32:189–196. - PubMed
-
- Chan TL, Goodchild AK, Martin PR. The morphology and distribution of horizontal cells in the retina of a new world monkey, the marmoset Callithrix jacchus: a comparison with macaque monkey. Visual Neuroscience. 1997;14:125–140. - PubMed
-
- Dacey DM, Lee BB. The blue-ON opponent pathway in primate retina originates from a distinct bistratified ganglion cell type. Nature. 1994;367:731–735. - PubMed
-
- Franco EC S, Yamada ES, Finlay BL, Silveira LCL, Crowley JC. Distribution of photoreceptors in retinae of New-World primates. Investigative Ophthalmology and Visual Science. 1998;39:S1060.
Publication types
MeSH terms
Substances
Grants and funding
LinkOut - more resources
Full Text Sources