

Rapid characterization of DNA oligomers and genotyping of single nucleotide polymorphism using nucleotide-specific mass tags
- PMID: 11433037
- PMCID: PMC55785
- DOI: 10.1093/nar/29.13.e61
Rapid characterization of DNA oligomers and genotyping of single nucleotide polymorphism using nucleotide-specific mass tags
Abstract
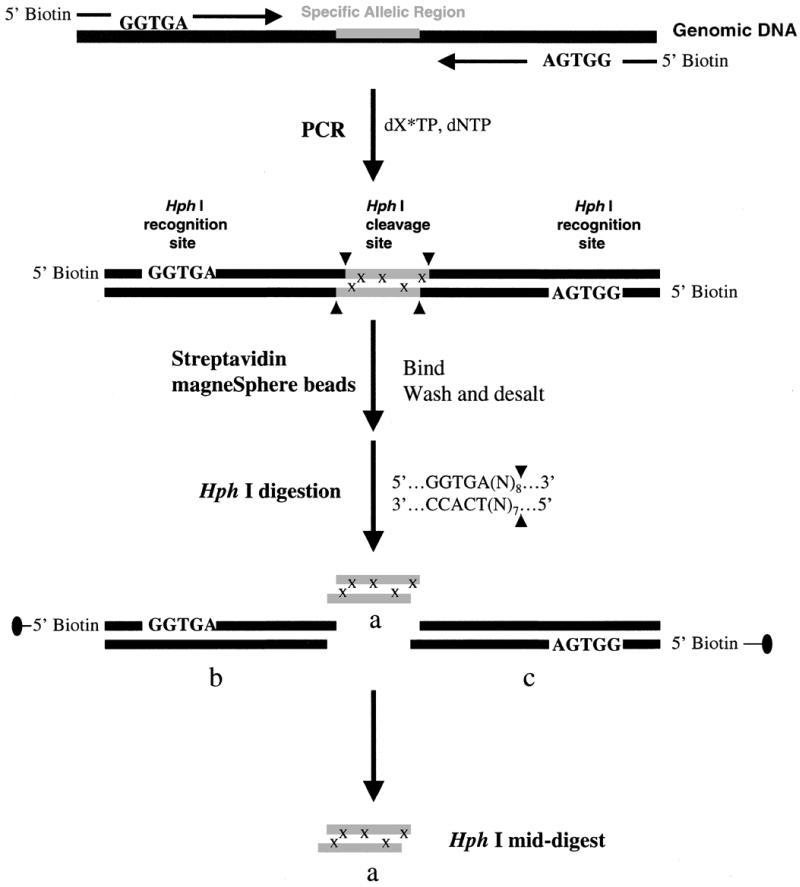
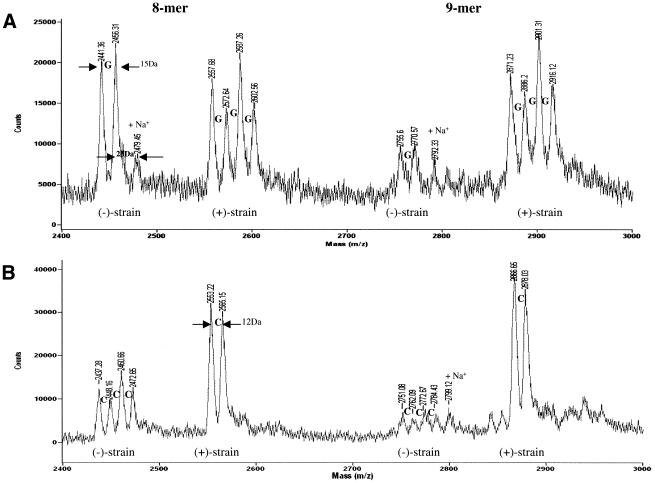
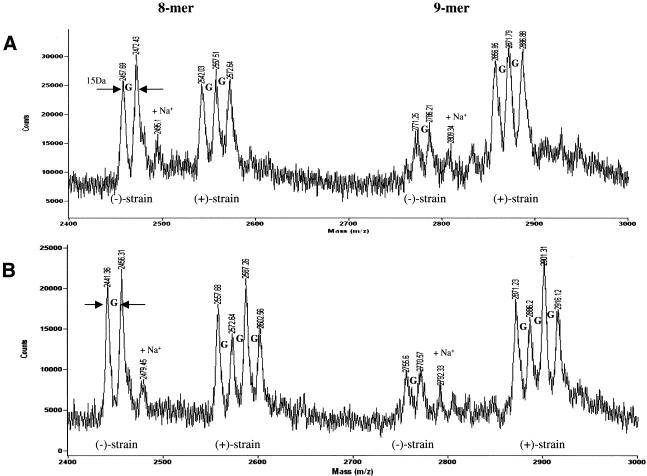
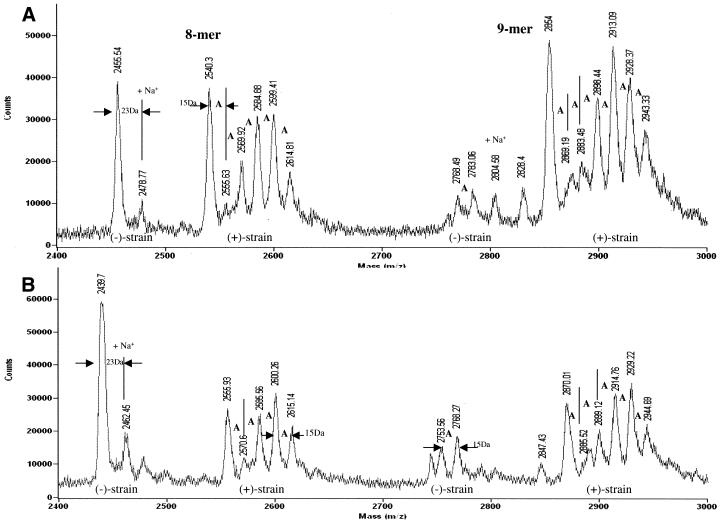
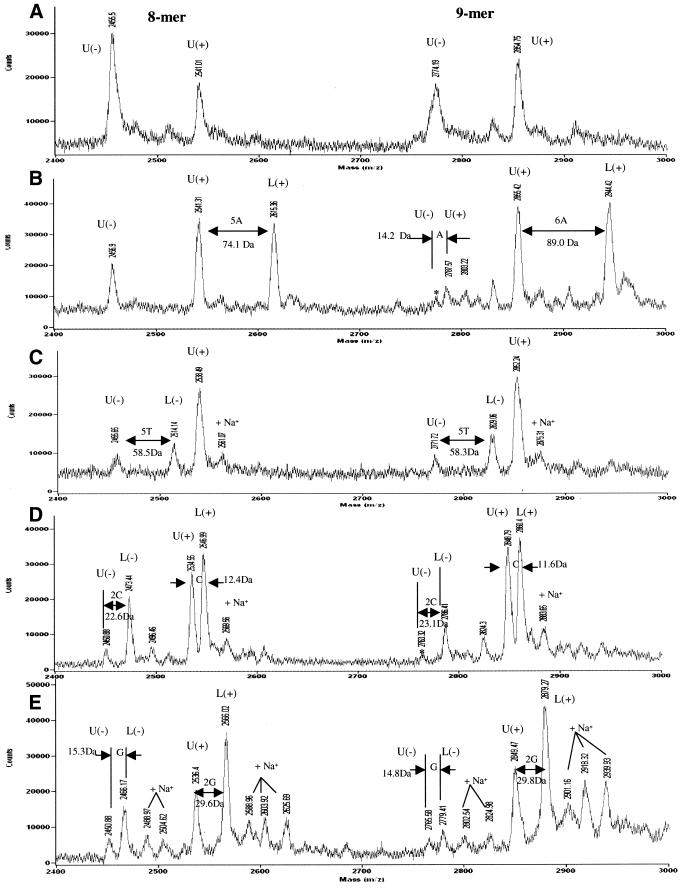
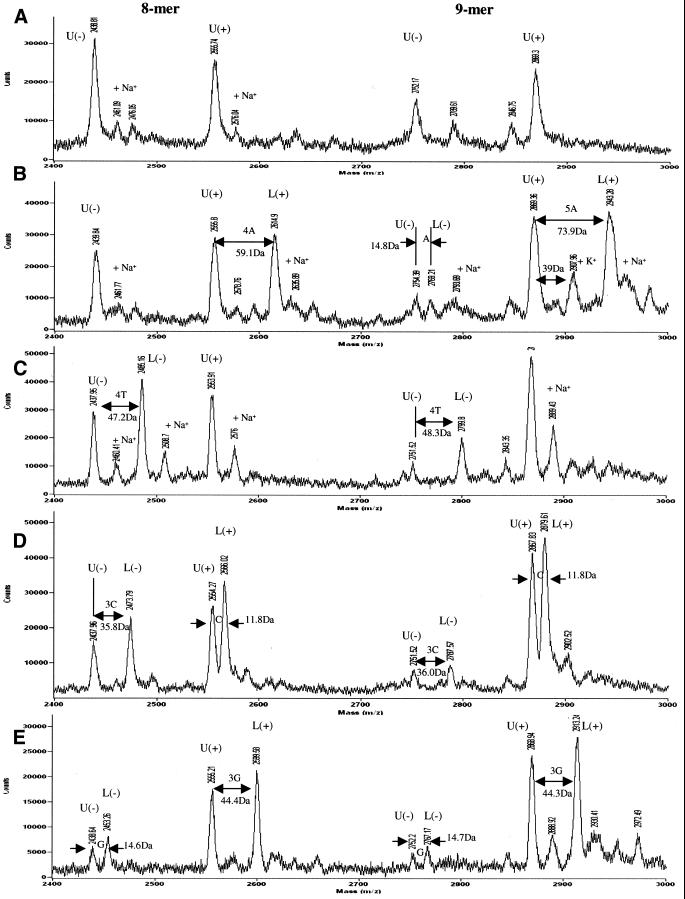
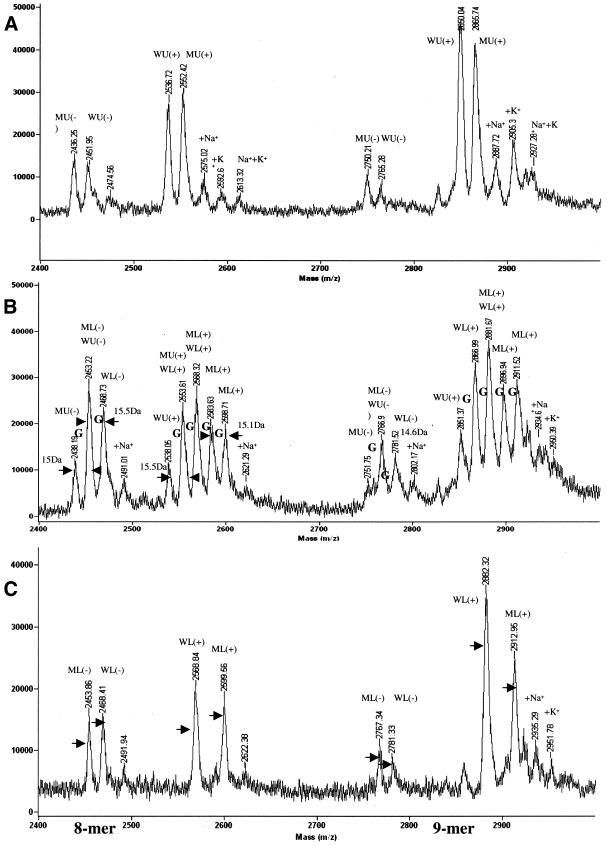
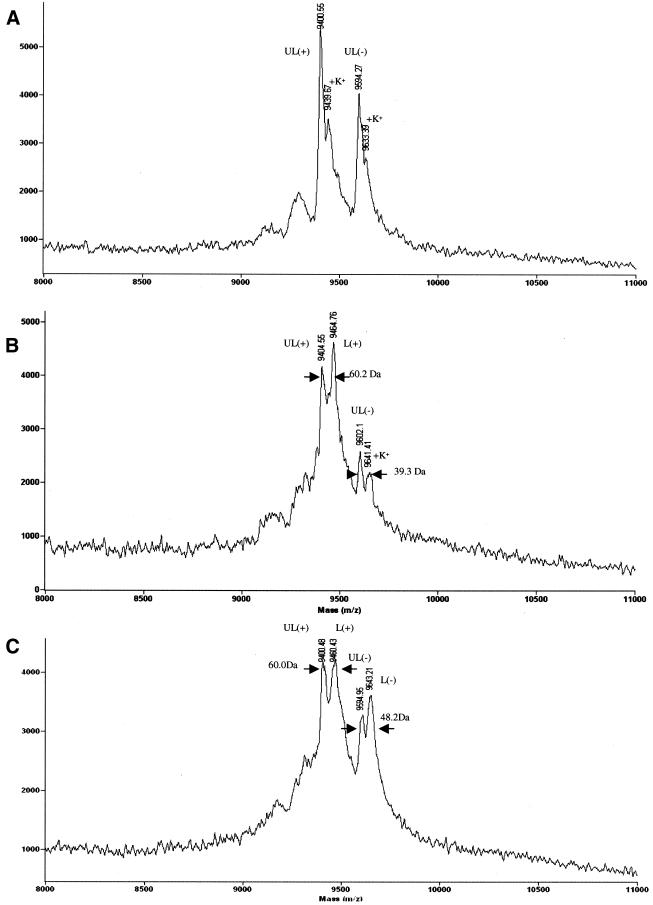
Using currently available MS-based methods, accurate mass measurements are essential for the characterization of DNA oligomers. However, there is a lack of specificity in mass peaks when the characterization of individual DNA species in a mass spectrum is dependent solely upon the mass-to-charge ratio (m/z). Here, we utilize nucleotide-specific tagging with stable isotopes to provide internal signatures that quantitatively display the nucleotide content of oligomer peaks in MS spectra. The characteristic mass-split patterns induced by the partially (13)C/(15)N-enriched dNTPs in DNA oligomers indicate the number of labeled precursors and in turn the base substitution in each mass peak, and provide for efficient SNP detection. Signals in mass spectra not only reflect the masses of particular DNA oligomers, but also their specific composition of particular nucleotides. The measurements of mass tags are relative in the mass-split pattern and, hence, the accuracy of the determination of nucleotide substitution is indirectly increased. For high sample throughput, (13)C/(15)N-labeled sequences of interest have been generated, excised in solution and purified for MS analysis in a single-tube format. This method can substantially improve the specificity, accuracy and efficiency of mass spectrometry in the characterization of DNA oligomers and genetic variations.
Figures
Similar articles
-
SNP and mutation discovery using base-specific cleavage and MALDI-TOF mass spectrometry.Bioinformatics. 2003;19 Suppl 1:i44-53. doi: 10.1093/bioinformatics/btg1004. Bioinformatics. 2003. PMID: 12855436
-
Solid phase capturable dideoxynucleotides for multiplex genotyping using mass spectrometry.Nucleic Acids Res. 2002 Aug 15;30(16):e85. doi: 10.1093/nar/gnf084. Nucleic Acids Res. 2002. PMID: 12177313 Free PMC article.
-
Extension of the GOOD assay for genotyping single nucleotide polymorphisms by matrix-assisted laser desorption/ionization mass spectrometry.Rapid Commun Mass Spectrom. 2003;17(12):1265-1272. doi: 10.1002/rcm.1050. Rapid Commun Mass Spectrom. 2003. PMID: 12811749
-
Genotyping single nucleotide polymorphisms by mass spectrometry.Mass Spectrom Rev. 2002 Nov-Dec;21(6):388-418. doi: 10.1002/mas.1009. Mass Spectrom Rev. 2002. PMID: 12666148 Review.
-
MALDI-TOF mass spectrometry-based SNP genotyping.Pharmacogenomics. 2002 Jul;3(4):537-48. doi: 10.1517/14622416.3.4.537. Pharmacogenomics. 2002. PMID: 12164776 Review.
Cited by
-
Single-nucleotide polymorphism of the urokinase-plasminogen activator gene during aging and transformation of human diploid kidney cell cultures.In Vitro Cell Dev Biol Anim. 2003 Sep-Oct;39(8-9):343-7. doi: 10.1290/1543-706X(2003)039<0343:SPOTUA>2.0.CO;2. In Vitro Cell Dev Biol Anim. 2003. PMID: 14686874
-
Development of a novel site-specific mutagenesis assay using MALDI-ToF MS (SSMA-MS).Nucleic Acids Res. 2006;34(22):e150. doi: 10.1093/nar/gkl745. Epub 2006 Nov 27. Nucleic Acids Res. 2006. PMID: 17130165 Free PMC article.
-
A simple and accurate SNP scoring strategy based on typeIIS restriction endonuclease cleavage and matrix-assisted laser desorption/ionization mass spectrometry.BMC Genomics. 2008 Jun 9;9:276. doi: 10.1186/1471-2164-9-276. BMC Genomics. 2008. PMID: 18538037 Free PMC article.
-
Validation of DNA sequences using mass spectrometry coupled with nucleoside mass tagging.Genome Res. 2002 Jul;12(7):1135-41. doi: 10.1101/gr.221402. Genome Res. 2002. PMID: 12097352 Free PMC article.
References
-
- Nature insight: Functional genomics (2000) Nature, 405, 819–865.
-
- Collins F.S., Guyer,M.S. and Chakravarti,A. (1997) Variations on a theme: cataloging human DNA sequence variation. Science, 278, 1580–1581. - PubMed
-
- Risch N. and Merikangas,K. (1996) The future of genetic studies of complex human diseases. Science, 273, 1516–1517. - PubMed
-
- Roses A.D. (2000) Pharmacogenetics and the practice of medicine. Nature, 405, 857–865. - PubMed
-
- Brookes A.J. (1999) The essence of SNPs. Gene, 234, 177–186. - PubMed
