Comparative Study
. 2001 Jul;11(7):1304-14.
doi: 10.1101/gr.159701.

Toward high-throughput genotyping: dynamic and automatic software for manipulating large-scale genotype data using fluorescently labeled dinucleotide markers

Affiliations
Comparative Study

Toward high-throughput genotyping: dynamic and automatic software for manipulating large-scale genotype data using fluorescently labeled dinucleotide markers

J L Li et al. Genome Res. 2001 Jul.

Abstract

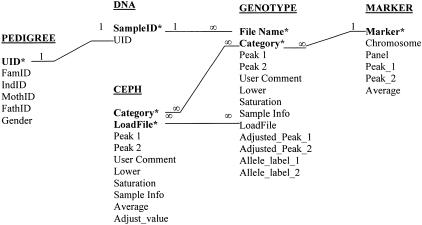
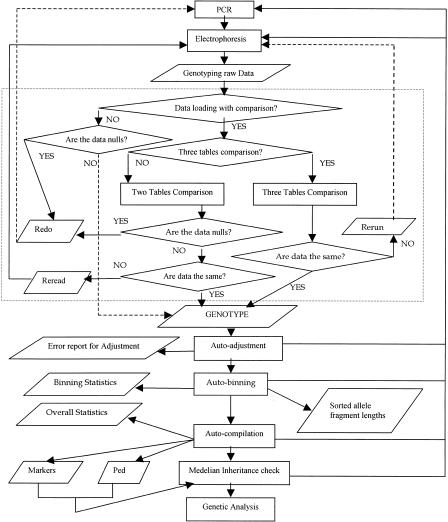
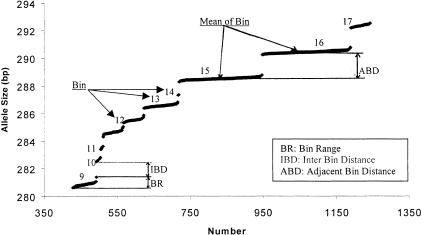
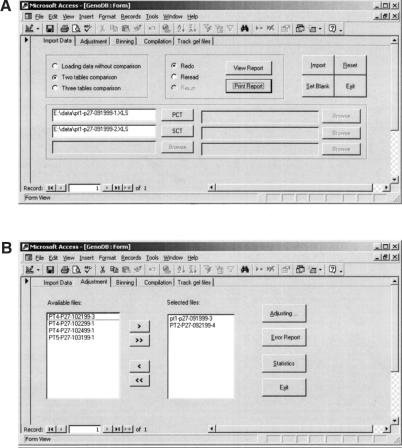
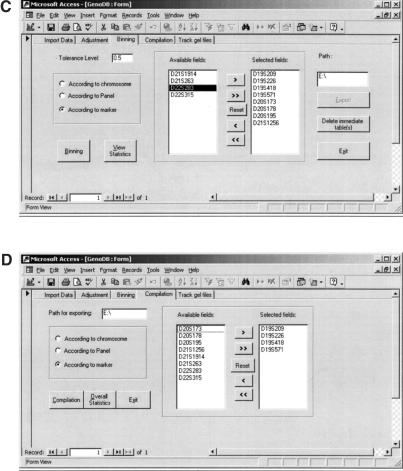
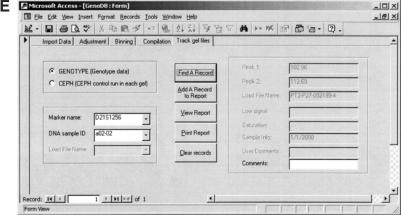
To efficiently manipulate large amounts of genotype data generated with fluorescently labeled dinucleotide markers, we developed a Microsoft database management system, named. offers several advantages. First, it accommodates the dynamic nature of the accumulations of genotype data during the genotyping process; some data need to be confirmed or replaced by repeat lab procedures. By using, the raw genotype data can be imported easily and continuously and incorporated into the database during the genotyping process that may continue over an extended period of time in large projects. Second, almost all of the procedures are automatic, including autocomparison of the raw data read by different technicians from the same gel, autoadjustment among the allele fragment-size data from cross-runs or cross-platforms, autobinning of alleles, and autocompilation of genotype data for suitable programs to perform inheritance check in pedigrees. Third, provides functions to track electrophoresis gel files to locate gel or sample sources for any resultant genotype data, which is extremely helpful for double-checking consistency of raw and final data and for directing repeat experiments. In addition, the user-friendly graphic interface of renders processing of large amounts of data much less labor-intensive. Furthermore, has built-in mechanisms to detect some genotyping errors and to assess the quality of genotype data that then are summarized in the statistic reports automatically generated by. The can easily handle >500,000 genotype data entries, a number more than sufficient for typical whole-genome linkage studies. The modules and programs we developed for the can be extended to other database platforms, such as Microsoft SQL server, if the capability to handle still greater quantities of genotype data simultaneously is desired.


Figures

Figure 1
Figure 1
Relational schema for GenoDB. (*), The field of a primary key of an entity; (1), the side of “one” relationship; (∞), the side of “many” relationship. The entity pedigree stores the pedigree information, including study subject unique identity ([UID]), family identity ([FamID]), study subject individual identity within a family ([IndID]), subject's mother's (father's) identity within a family ([MothID], [FathID]), and gender information ([Gender]). dna stores the DNA sample information, including DNA sample identity ([SampleID]) and corresponding study subject unique identity ([UID]). The fields [File Name], [Category], [Peak 1], [Peak 2], [User Comment], [Lower Signal], [Saturation], and [Sample Info] in both the entities ceph and genotype are defined the same as those used in the software GENOTYPER (version 2.1). The fields [LoadFile], [Adjusted_Peak_1], [Adjusted_Peak_1], [Allele_label_1], and [Allele_label_2] in the entity genotype are explained in the text. ceph stores the information of CEPH controls that run in a fixed place in each gel. The field [LoadFile] is explained in the text. [Average] stores the mean length of [Peak 1] and [Peak 2] of the entity ceph. [Adjust_value] stores the difference between the [Average] of CEPH control (in the ceph entity) obtained from experiments and the [Average] of CEPH standard (in the marker entity) obtained from published data from the web for the same dinucleotide marker. The fields [Marker], [Chromosome], and [Panel] in the entity marker store the information for marker name, the chromosome where a marker is located, and the panel where the marker is placed. The fields [Peak_1] and [Peak_2] store the published values of fragment length for CEPH 1347–02 from the Web site of Perkin-Elmer Applied Biosystems (http://www.pebio.com/ab/apply/dr/lmsv2). The field [Average] in the entity marker stores the mean of [Peak_1] and [Peak_2].
Figure 2
Figure 2
Data flow of GenoDB. The rectangle indicates the process in the data flow chart; a diamond indicates a decision in the flowchart; a parallelogram indicates stored data. The section contained within the dotted lines indicates the data loading module.
Figure 3
Figure 3
A sorted allele fragment length scatter plot for the dinucleotide marker D20S196. Part of the genotype data of D20S196 is plotted. See text for the definition of BR, IBD, and ABD.
Figure 4
Figure 4
Screen views of GenoDB's user-friendly GUI. Plots (A), (B), (C), (D) and (E) are, respectively, the actual screen views for the following modules: data loading, adjustment of allele fragment lengths, allele binning, compilation of genotype data for Mendelian inheritance check for PedCheck, and the function of tracking the sources of genotype data and CEPH control that runs on each gel.
Figure 4
Figure 4
Screen views of GenoDB's user-friendly GUI. Plots (A), (B), (C), (D) and (E) are, respectively, the actual screen views for the following modules: data loading, adjustment of allele fragment lengths, allele binning, compilation of genotype data for Mendelian inheritance check for PedCheck, and the function of tracking the sources of genotype data and CEPH control that runs on each gel.

References

    1. ABI PRISM. Genotyper version 2.1, user's manual. Foster City, CA: Perkin-Elmer Applied Biosystems; 1996.
    1. ABI PRISM. Linkage mapping set version 2, user's manual. Foster City, CA: Perkin-Elmer Applied Biosystems; 1997.
    1. Almasy L, Blangero J. Multipoint quantitative trait linkage analysis in general pedigrees. Am J Hum Genet. 1998;62:1198–1211. - PMC - PubMed
    1. Chen PP. The entity-relationship model — toward a unified view of data. ACM Trans Database Syst. 1976;1:9–36.
    1. Cheung KH, Nadkarni P, Silversten S, Kidd JR, Pakstis AJ, Miller P, Kidd KK. PhenDB: An integrated client/server database for linkage and population genetics. Comput Biomed Res. 1996;29:327–337. - PubMed

Publication types

Substances

LinkOut - more resources