. 2001 Jul;108(1):131-41.
doi: 10.1172/JCI10360.

Adenosine deaminase deficiency increases thymic apoptosis and causes defective T cell receptor signaling

Affiliations

Adenosine deaminase deficiency increases thymic apoptosis and causes defective T cell receptor signaling

S G Apasov et al. J Clin Invest. 2001 Jul.

Abstract

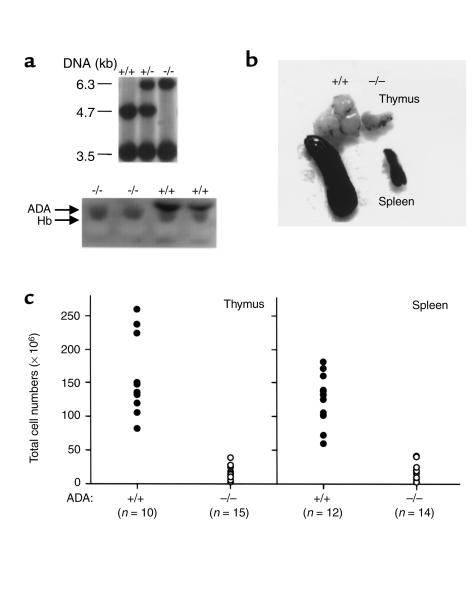
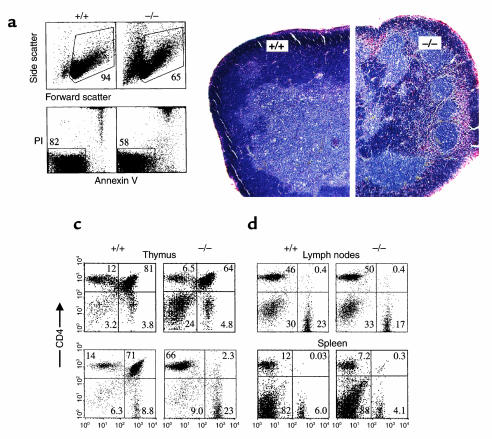
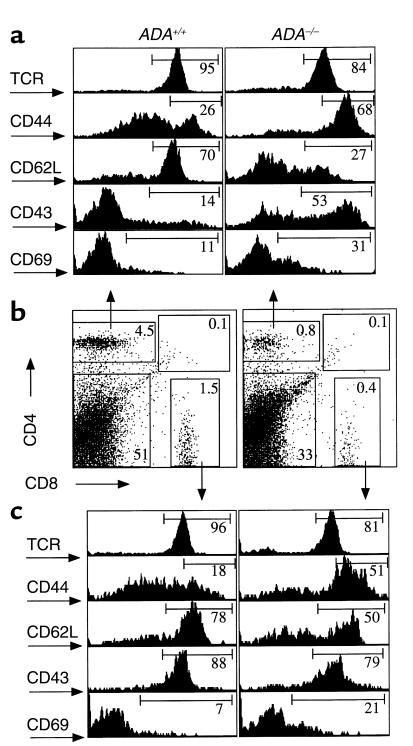
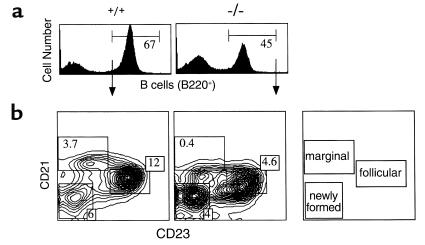
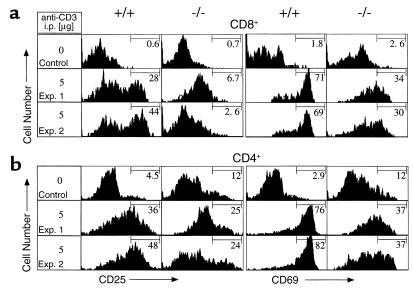
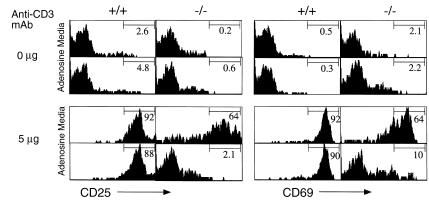
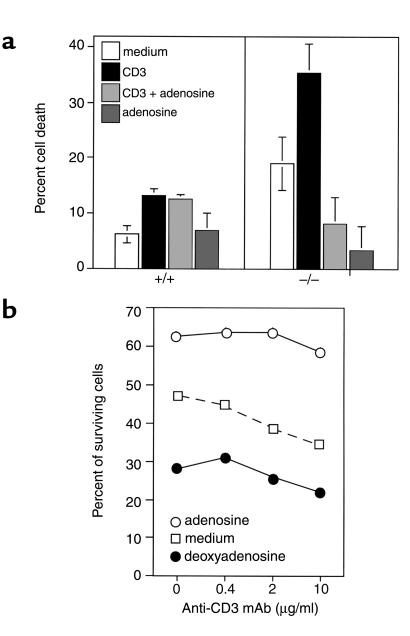
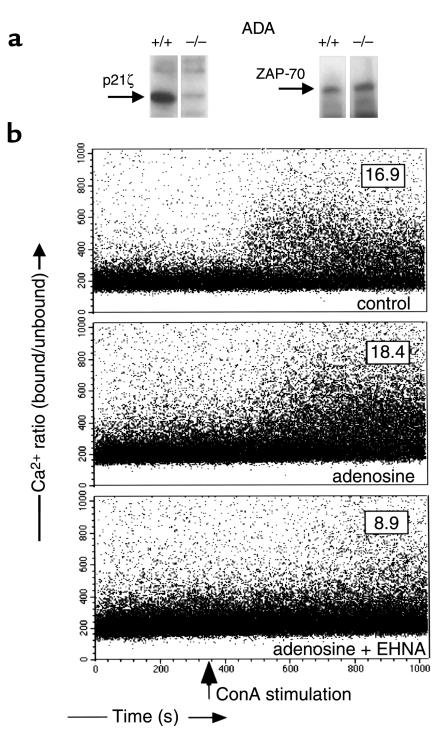
Adenosine deaminase (ADA) deficiency in humans results in a severe combined immunodeficiency (SCID). This immunodeficiency is associated with severe disturbances in purine metabolism that are thought to mediate lymphotoxicity. The recent generation of ADA-deficient (ADA(-/-)) mice has enabled the in vivo examination of mechanisms that may underlie the SCID resulting from ADA deficiency. We demonstrate severe depletion of T and B lymphocytes and defects in T and B cell development in ADA(-/-) mice. T cell apoptosis was abundant in thymi of ADA(-/-) mice, but no increase in apoptosis was detected in the spleen and lymph nodes of these animals, suggesting that the defect is specific to developing thymocytes. Studies of mature T cells recovered from spleens of ADA(-/-) mice revealed that ADA deficiency is accompanied by TCR activation defects of T cells in vivo. Furthermore, ex vivo experiments on ADA(-/-) T cells demonstrated that elevated adenosine is responsible for this abnormal TCR signaling. These findings suggest that the metabolic disturbances seen in ADA(-/-) mice affect various signaling pathways that regulate thymocyte survival and function. Experiments with thymocytes ex vivo confirmed that ADA deficiency reduces tyrosine phosphorylation of TCR-associated signaling molecules and blocks TCR-triggered calcium increases.


Figures

Figure 1
Figure 1
Demonstration of extensive cell death in thymus but not in peripheral lymphoid organs of ADA–/– mice. (a) Genetic and biochemical evidence of ADA deficiency in screening for ADA+/+, ADA+/–, and ADA–/– mice. Littermates of ADA heterozygous mice were first analyzed by zymogram assay to identify ADA–/– mice, and then tail DNA samples were analyzed by Southern blot as described in ref. . Arrowheads on the zymogram indicate position of ADA and hemoglobin (internal control). (b) Comparison of spleens and thymi from ADA+/+ and ADA–/– littermates. ×3. (c) Decreased cellularity of lymphoid organs of ADA–/– mice. n, number of animals analyzed.
Figure 2
Figure 2
Increased apoptosis in the thymus but not in the lymph nodes or spleens of ADA–/– mice. (a) Top: Side scatter versus forward scatter evaluation of proportion of dead cells in thymus of ADA+/+ and ADA–/– littermates. Numbers indicate percentage of live cells in the lymphoid organ. Bottom: Propidium iodide and Annexin V–aided evaluation of proportion of dead cells in thymus of ADA+/+ and ADA–/– littermates. Numbers indicate the percentage of live cells in the lower left gate estimated using both Annexin V and PI cell death flow cytometry assay as described in Methods. (b) Cytochemical demonstration of extensive clusters of apoptotic cells in thymus of ADA–/– but not of ADA+/+ littermates. Apoptotic cells are shown in red. The frozen tissue preparations and apoptosis detection were performed as described in Methods. (c) Flow cytometry demonstration of thymocyte distribution in thymi of ADA–/– and ADA+/+ littermates. (d) Flow cytometry demonstration of normal subset distributions in lymph nodes and spleens of ADA–/– mice compared with organs of ADA+/+ littermates. Numbers indicate the percentage of live cells in different subsets estimated as described in Methods.
Figure 3
Figure 3
Changes in phenotype of peripheral CD4+ and CD8+ T cells from spleens of ADA–/– mice. Splenocytes of ADA–/– and ADA+/+ littermates were analyzed by three-color flow cytometry. Expression of different cell surface markers on CD4+ cells (a) and CD8+ cells (c) were analyzed by using CD4/CD8 gates as indicated by arrows in b. Numbers indicate proportions of cell from total cell population (b) or among gated cells (a and c).
Figure 4
Figure 4
Changes in phenotype of peripheral B cells from spleens of ADA–/– mice. Splenocytes of ADA–/– and ADA+/+ littermates were analyzed by three-color flow cytometry as described in Methods and indicated by arrows. (a) Evaluation of B220+ B cells in ADA–/– and ADA+/+ littermates. Numbers represent percentage of B cells from total splenocytes. (b) Distribution of B cells among marginal, follicular, and newly formed zones of spleen in ADA–/– versus ADA+/+ mice. Numbers indicate percentage of cells in different zones. Cartoon illustrates location of different B cell subsets according to staining with mAb to CD21 and CD23.
Figure 5
Figure 5
Inhibited TCR-triggered activation of T cells in an ADA-deficient environment in vivo. ADA+/+ and ADA–/– littermates were injected intraperitoneally (i.p.) with PBS (control) or anti-CD3 mAb; 16 hours later, spleens were harvested and analyzed by flow cytometry for expression of T cell activation markers as described in Methods. Representative results of two (Exp. 1 and Exp. 2) of more than ten similar experiments using more than 20 pairs of littermates of ADA–/– and ADA+/+ mice are presented. (a) Comparison of TCR-triggered upregulation of CD25 and CD69 surface antigens on CD8+ T cells in an ADA–/– or ADA+/+ in vivo environment after injection of 5 μg of anti-CD3 mAb. (b) Comparison of TCR-triggered upregulation of CD25 and CD69 surface antigens on CD4+ T cells in an ADA-deficient or ADA-containing in vivo environment after injection of 5 μg of anti-CD3 mAb.
Figure 6
Figure 6
Effect of adenosine on TCR-triggered upregulation of CD25 and CD69 activation markers in vitro. Ex vivo spleen cells from ADA–/– and ADA+/+ littermates were incubated in 96-well plates with immobilized anti-CD3 mAb (5 μg/ml mAb) or with serum-free, ADA-free media alone (0 μg/ml mAb) in the presence or absence of adenosine (100 μM); 16 hours later, TCR-triggered upregulation of the T cell activation markers CD69 and CD25 was evaluated by flow cytometry.
Figure 7
Figure 7
Extracellular adenosine inhibits TCR-induced signaling in thymocytes. (a) Adenosine alone inhibits TCR-triggered apoptosis in ADA–/– but not in normal ADA+/+ thymocytes. (b) Demonstration of opposite effects of adenosine and 2′-deoxyadenosine on spontaneous and TCR-triggered apoptosis in ADA–/– thymocytes. Thymocytes from wild-type or ADA–/– mice were incubated for 16 hours in 96-well plates with apoptosis-inducing immobilized anti-CD3 mAb in the presence or absence of added adenosine (100 μM) or 2′-deoxyadenosine (100 μM). The effect of adenosine and 2′-deoxyadenosine on thymocyte survival (proportion of live cells) was evaluated using Annexin V assay as described in the Methods.
Figure 8
Figure 8
ADA deficiency is accompanied with defects in TCR signaling pathways in vivo and in vitro. (a) Partial phosphorylation of CD3 ζ chain is notably reduced in nonactivated ex vivo thymocytes from ADA–/– mice, whereas ZAP-70 levels are shown to be the same in parallel samples of immunoprecipitates from ex vivo thymocytes harvested from ADA–/– and ADA+/+ littermates. (b) Intracellular Ca2+ mobilization upon ConA stimulation is inhibited by adenosine in normal thymocytes in the presence of the ADA inhibitor EHNA. Thymocytes from ADA+/+ or ADA–/– mice were used for isolation of ZAP-70 immunocomplexes followed by immunoblotting analysis of TCR ζ chain phosphorylation with an anti phosphotyrosine mAb as described in Methods. Anti ZAP-70 mAb’s were used in control immunoblotting. For measurements of calcium flux ADA+/+ thymocytes were preloaded with indo-1 and analyzed on a FACSVantage flow cytometer as described in Methods. The percentages of cells that increase intracellular calcium after stimulation with Concanavalin A are shown on the graphs. Adenosine (100 μΜ) alone or in combination with EHNA (10 μM) was added a minute before the ConA stimulation. Arrow indicates time of injection of T cell–activating stimuli.

References

    1. Giblett ER, Anderson JE, Cohen F, Pollara B, Meuwissen HJ. Adenosine-deaminase deficiency in two patients with severely impaired cellular immunity. Lancet. 1972;2:1067–1069. - PubMed
    1. Giblett ER, Ammann AJ, Wara DW, Sandman R, Diamond LK. Nucleoside-phosphorylase deficiency in a child with severely defective T-cell immunity and normal B-cell immunity. Lancet. 1975;1:1010–1013. - PubMed
    1. Buckley RH, et al. Human severe combined immunodeficiency: genetic, phenotypic, and functional diversity in one hundred eight infants. J Pediatr. 1997;130:378–387. - PubMed
    1. Hershfield, M.S., and Mitchell, B.S. 1995. Immunodeficiency diseases caused by adenosine deaminase deficiency and purine nucleoside phosphorylase deficiency. In The molecular and metabolic bases of inherited disease. C.R. Scriver, A.L. Beaudet, W.S. Sly, and D. Valle, editors. McGraw-Hill. New York, New York, USA. 1725–1768.
    1. Olah ME, Stiles GL. Adenosine receptor subtypes: characterization and therapeutic regulation. Annu Rev Pharmacol Toxicol. 1995;35:581–606. - PubMed

Publication types

MeSH terms