. 2001 Jul 2;194(1):29-44.
doi: 10.1084/jem.194.1.29.

Murine cytomegalovirus is regulated by a discrete subset of natural killer cells reactive with monoclonal antibody to Ly49H

Affiliations

Murine cytomegalovirus is regulated by a discrete subset of natural killer cells reactive with monoclonal antibody to Ly49H

K A Daniels et al. J Exp Med. .

Abstract

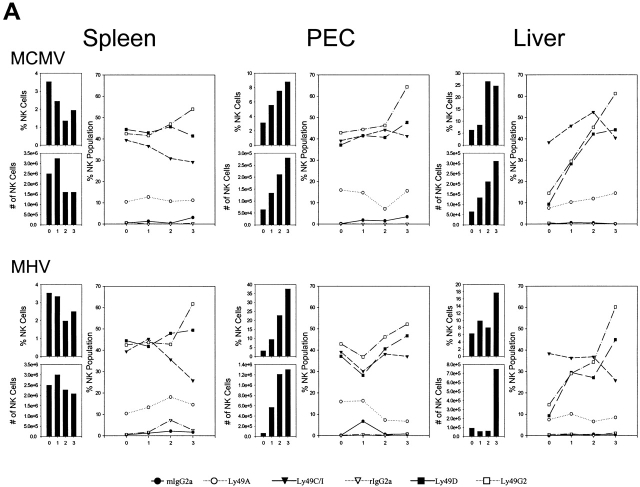
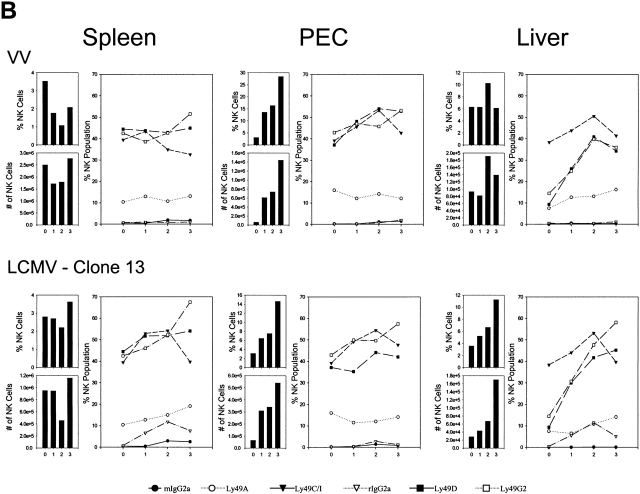
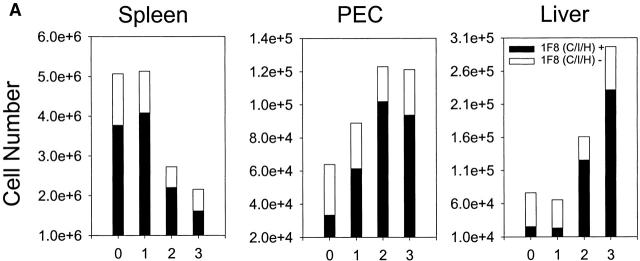
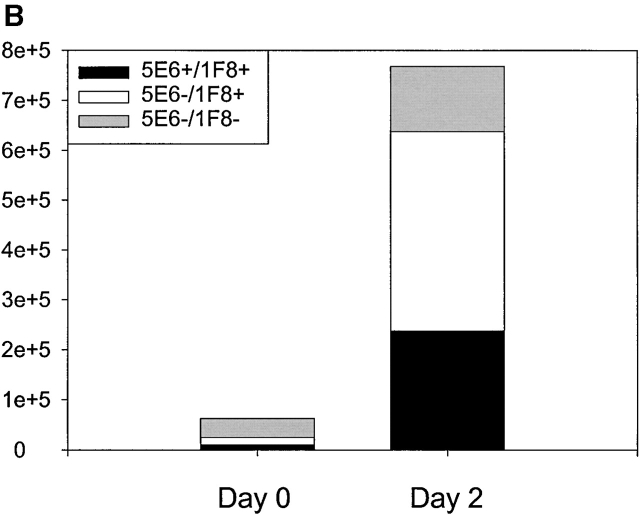
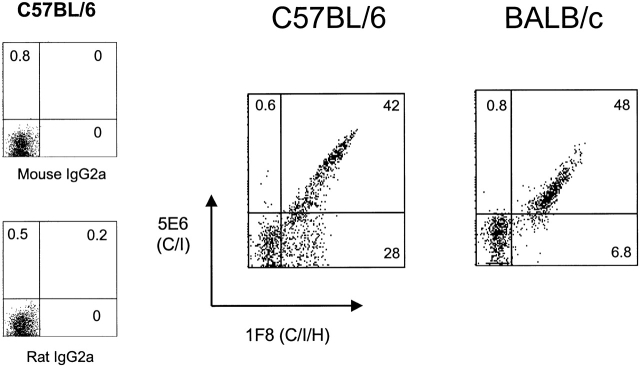
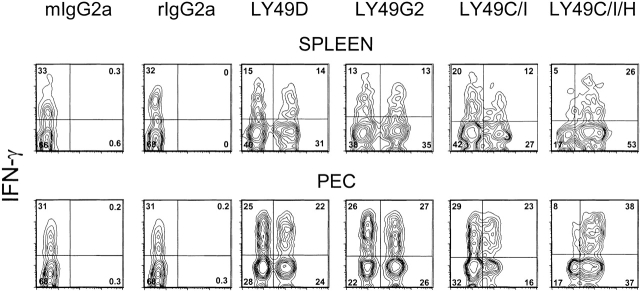
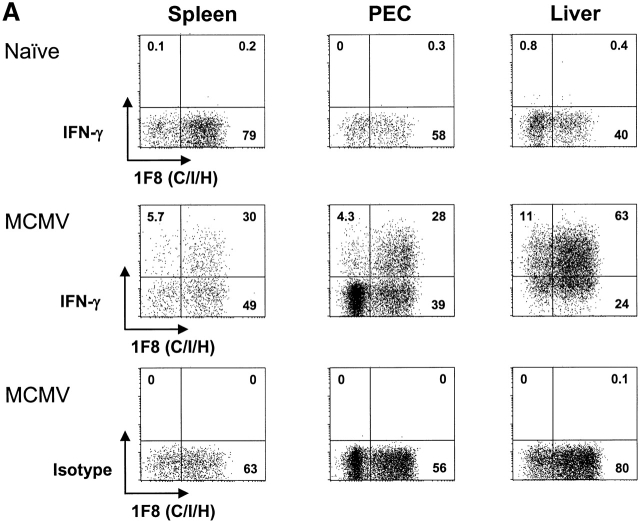
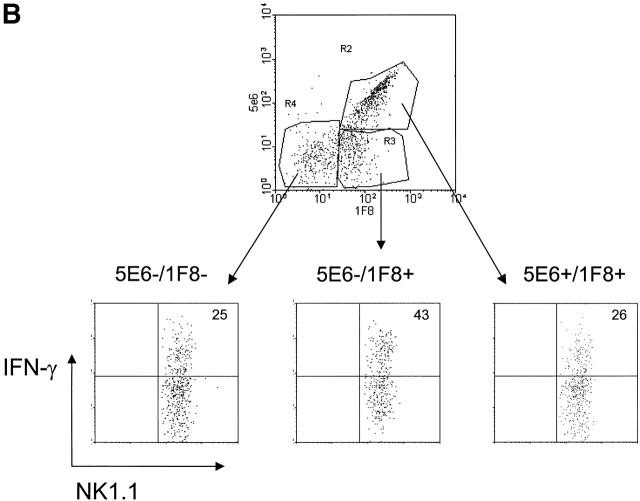
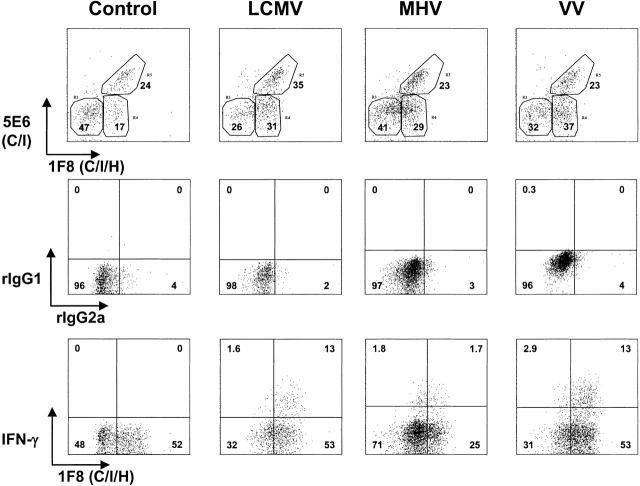
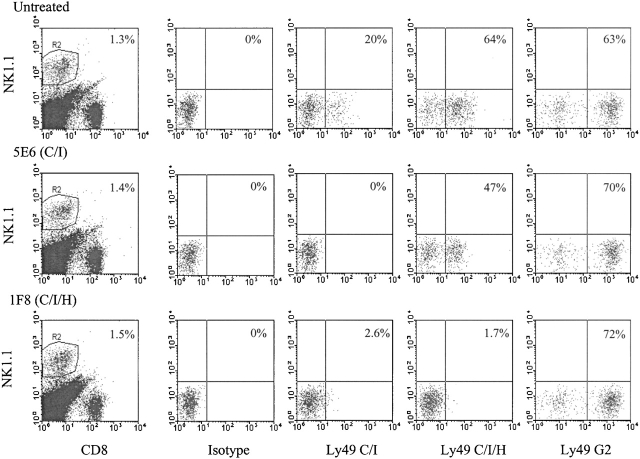
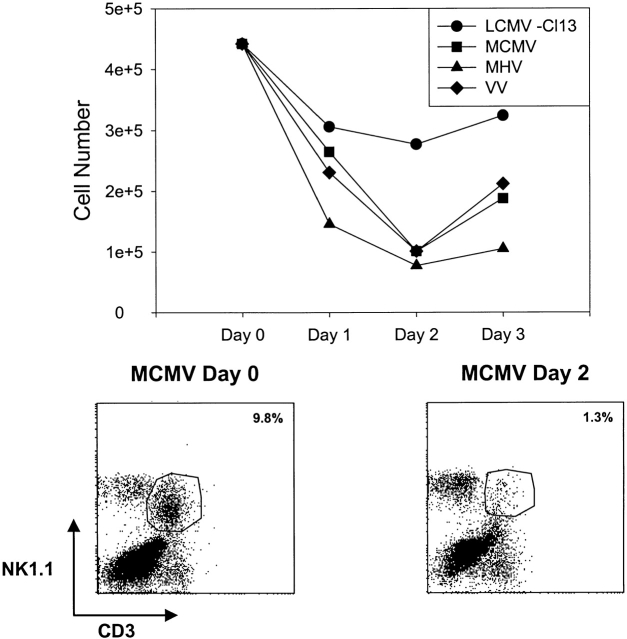
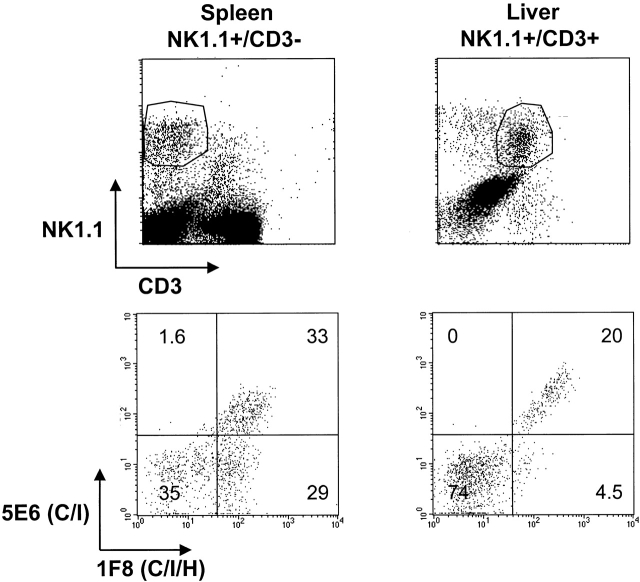
Antiviral roles of natural killer (NK) cell subsets were examined in C57BL/6 mice infected with murine cytomegalovirus (MCMV) and other viruses, including lymphocytic choriomeningitis virus (LCMV), vaccinia virus (VV), and mouse hepatitis virus (MHV). Each virus vigorously induced an NK cell infiltrate into the peritoneal cavity and liver, causing some redistributions of NK cell subsets defined by monoclonal antibody (mAb) directed against Ly49A, C/I, D, and G2. Striking results were seen with a mAb (1F8) reactive with the positively signaling molecule Ly49H, present in MCMV-resistant C57BL/6 mice. mAb 1F8 also stains Ly49 C and I, but exclusion of those reactivities with mAb 5E6, which recognizes Ly49 C and I, indicated that Ly49H(+) cells infiltrated the peritoneal cavity and liver and were particularly effective at synthesizing interferon gamma. Depletion of 1F8(+) but not 5E6(+) cells in vivo by mAb injections enhanced MCMV titers by 20-1,000-fold in the spleen and approximately fivefold in the liver. Titers of LCMV or VV were not enhanced. These anti-MCMV effects were attributed to prototypical NK1.1(+)CD3(-) NK cells and not to NK1.1(+)CD3(+) "NK/T" cells. This is the first evidence that control of a virus infection in vivo is mediated by a distinct NK cell subset.


Figures

Figure 1
Figure 1
Dynamics of the NK cell response to virus infections. Spleen, PECs, and liver leukocyte populations were isolated and examined daily after infections of C57BL/6 mice with MCMV (A), MHV (A), VV (B), and LCMV clone 13 (B). Line diagrams depict the percentage of gated NK1.1+CD3 NK cells reacting with mAb to Ly49A, C/I, D, or G2, or with appropriate isotype control Abs. To the left of each line diagram are vertical bars depicting the percentage of NK1.1+CD3 cells in lymphocyte-gated fractions (top) and the total number of NK1.1+CD3 cells per organ (bottom).
Figure 1
Figure 1
Dynamics of the NK cell response to virus infections. Spleen, PECs, and liver leukocyte populations were isolated and examined daily after infections of C57BL/6 mice with MCMV (A), MHV (A), VV (B), and LCMV clone 13 (B). Line diagrams depict the percentage of gated NK1.1+CD3 NK cells reacting with mAb to Ly49A, C/I, D, or G2, or with appropriate isotype control Abs. To the left of each line diagram are vertical bars depicting the percentage of NK1.1+CD3 cells in lymphocyte-gated fractions (top) and the total number of NK1.1+CD3 cells per organ (bottom).
Figure 3
Figure 3
Reactivity of leukocytes with mAb 1F8 after MCMV infection. (A) C57BL/6 mice were inoculated intraperitoneally with MCMV and the total number of gated NK1.1+CD3 NK cells costaining with mAb 1F8 was monitored by multiplying the percentage of positively staining cells by the total number or organ lymphocytes. (B) The experiment was designed as in A, except that at day 2 after infection, NK1.1+CD3–gated liver NK cells were stained with both mAb 5E6 (anti-Ly49C/I) and 1F8 (anti-Ly49C/I/H). The 5E61F8+ cells are presumed to express Ly49H but not Ly49 C or I.
Figure 3
Figure 3
Reactivity of leukocytes with mAb 1F8 after MCMV infection. (A) C57BL/6 mice were inoculated intraperitoneally with MCMV and the total number of gated NK1.1+CD3 NK cells costaining with mAb 1F8 was monitored by multiplying the percentage of positively staining cells by the total number or organ lymphocytes. (B) The experiment was designed as in A, except that at day 2 after infection, NK1.1+CD3–gated liver NK cells were stained with both mAb 5E6 (anti-Ly49C/I) and 1F8 (anti-Ly49C/I/H). The 5E61F8+ cells are presumed to express Ly49H but not Ly49 C or I.
Figure 2
Figure 2
Expression of Ly49H on NK cells from different strains of mice. C57BL/6 and Balb/c splenocytes were stained with mAb DX-5 (as a pan NK cell marker that would recognize cells from each strain), anti-CD3, and mAb 1F8 (anti-Ly49 C/I/H) and mAb 5E6 (anti-Ly49 C/I). Diagrams depict the staining of gated DX-5+CD3 lymphocytes and isotype controls for mAb 5E6 and 1F8.
Figure 5
Figure 5
Lack of selective IFN-γ production by Ly49D- or Ly49G2-expressing NK cells. Gated NK1.1+CD3 NK cells from the spleens and PECs of 2-d MCMV-infected C57BL/6 mice were stained with Abs to Ly49D, G2, C/I (mAb 5E6), or C/I/H (mAb 1F8) and tested for spontaneous IFN-γ production. Isotype controls for the Ly49 mAb are displayed. Isotype controls for the IFN-γ Ab were <1%, as seen in Fig. 4.
Figure 4
Figure 4
Pronounced IFN-γ production by NK cells reacting with mAb 1F8. (A) Spleen, PECs, or liver lymphocytes were monitored for spontaneous IFN-γ production before or 2 d after intraperitoneal infection with MCMV. The plots show NK1.1+CD3–gated NK cells reacting with mAb 1F8 and producing intracellular IFN-γ in the presence of brefeldin A. Isotype control mAbs for IFN-γ showed virtually no (<1%) reactivity for any of the samples and are displayed for the MCMV-infected group. (B) NK1.1+–gated spleen NK cells 2 d after MCMV infection were costained with mAb 5E6 and 1F8 and tested for IFN-γ production.
Figure 4
Figure 4
Pronounced IFN-γ production by NK cells reacting with mAb 1F8. (A) Spleen, PECs, or liver lymphocytes were monitored for spontaneous IFN-γ production before or 2 d after intraperitoneal infection with MCMV. The plots show NK1.1+CD3–gated NK cells reacting with mAb 1F8 and producing intracellular IFN-γ in the presence of brefeldin A. Isotype control mAbs for IFN-γ showed virtually no (<1%) reactivity for any of the samples and are displayed for the MCMV-infected group. (B) NK1.1+–gated spleen NK cells 2 d after MCMV infection were costained with mAb 5E6 and 1F8 and tested for IFN-γ production.
Figure 6
Figure 6
Involvement of 1F8+ NK cells in the response to LCMV, MHV, and VV. (Top) Reactivity with mAb 5E6 and 1F8 on gated NK1.1+CD3 lymphocytes isolated from the peritoneal cavity of C57BL/6 control mice or mice 2 d after intraperitoneal infection with LCMV clone 13, MHV, or VV. (Middle and bottom rows) Staining after incubation in an intracellular IFN-γ assay. (Middle) Isotype control mAb staining for mAb to IFN-γ (rIgG1-APC) and mAb 1F8 (rIgG2a-FITC) for NK1.1+CD3–gated lymphocytes from the same mice. (Bottom) Reactivity of NK1.1+CD3 lymphocytes with mAb to IFN-γ and to 1F8.
Figure 7
Figure 7
C57BL/6 mice (n = 5 per group) were inoculated with HBSS (untreated), 200 μg mAb 5E6, or 200 μg mAb 1F8 and infected with MCMV 6 h later. 4 d later splenocytes were isolated. NK1.1+CD8 cells were costained with mAb 5E6 (Ly49C/I), 1F8 (Ly49C/I/H), anti-Ly49G2, or a mAb isotype control. In this case they were also costained with mAb to CD8 (as part of an experiment examining both T and NK cell functions), so the NK1.1+ cells may include both NK and NK/T cells. This figure shows selective depletions of some of the Ly49 subsets due to this mAb treatment. These same mice were examined for viral load, and those data are listed in experiment 1 (Table ).
Figure 8
Figure 8
Hematoxylin and eosin staining of MCMV-infected liver sections. (A and B) C57BL/6 liver 4 d after MCMV infection. A, original magnification: 20×; B, original magnification: 60×. Note the discrete inflammatory foci (A) around hepatocytes showing MCMV-induced cytopathology (B). (C and D) Livers from mAb 1F8-treated MCMV-infected mice. Note the absence of discrete inflammatory foci and the presence of large necrotic areas shown by arrows in C and sometimes near the surface (D) of the liver. C, original magnification: 4×; D, original magnification: 10×.
Figure 9
Figure 9
Reduction in NK/T cell numbers in livers of virus-infected mice. (Top) This represents the total NK1.1+CD3+ (NK/T) cell numbers isolated from the livers of C57BL/6 mice at different days after infection with either of several viruses. This representative experiment shows data from pooled livers from at least three mice per group. (Bottom) This shows NK1.1+CD3+ liver leukocytes from uninfected control mice (Day 0) and mice 2 d after MCMV infection (Day 2).
Figure 10
Figure 10
Low frequency of mAb 1F8+5E6 NK/T cells. Prototypical NK1.1+CD3 NK cells from the spleens of uninfected mice and NK1.1+CD3+ NK/T cells from the livers of uninfected mice (top) were costained with mAb to 1F8 (Ly49C/I/H) or 5E6 (Ly49C/I) (bottom). These leukocyte sources were selected to give the most unambiguous data with the least amount of cellular cross-contamination.

References

    1. Tay C.-H., Szomolanyi-Tsuda E., Welsh R.M. Control of infections by NK cells. Curr. Top. Microbiol. Immunol. 1998;230:193–220. - PubMed
    1. Lanier L.L. NK cell receptors. Annu. Rev. Immunol. 1998;16:359–393. - PubMed
    1. Yokoyama W.M. What goes up must come downthe emerging spectrum of inhibitory receptors. J. Exp. Med. 1997;186:1803–1808. - PMC - PubMed
    1. Gosselin P., Mason L.H., Willette-Brown J., Ortaldo J.R., McVicar D.W., Anderson S.K. Induction of DAP12 phosphorylation, calcium mobilization, and cytokine secretion by Ly49H. J. Leuk. Biol. 1999;66:165–171. - PubMed
    1. Yokoyama W.M., Ryan J.C., Hunter J.J., Smith H.R.C., Stark M., Seaman W.E. DNA cloning of mouse NKR-1 and genetic linkage with Ly-49. Identification of a natural killer gene complex on mouse chromosome 6. J. Immunol. 1991;147:3229–3236. - PubMed

Publication types

MeSH terms