. 2001 Jul 2;194(1):45-56.
doi: 10.1084/jem.194.1.45.

A coordinated change in chemokine responsiveness guides plasma cell movements

Affiliations

A coordinated change in chemokine responsiveness guides plasma cell movements

D C Hargreaves et al. J Exp Med. .

Abstract

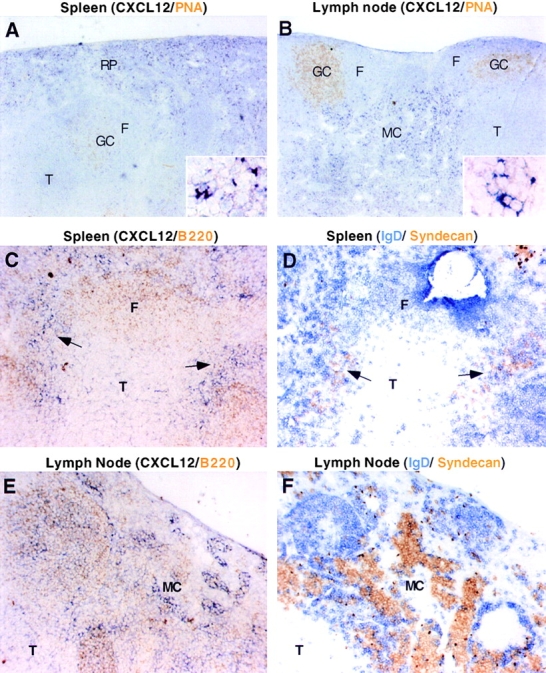
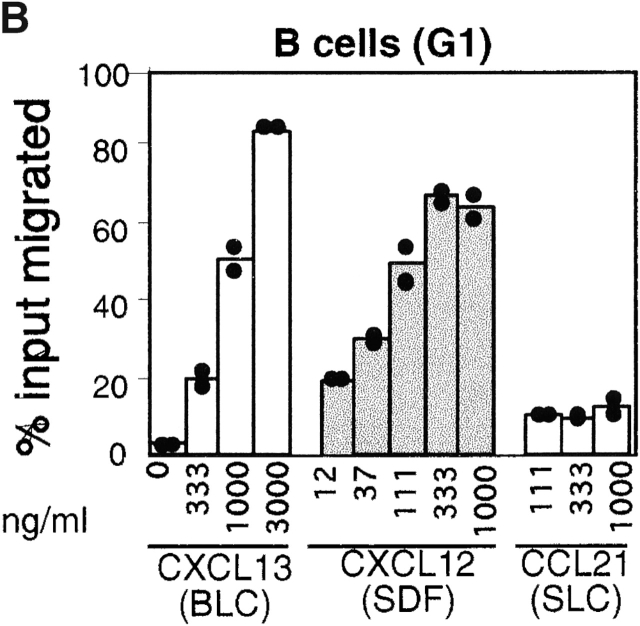
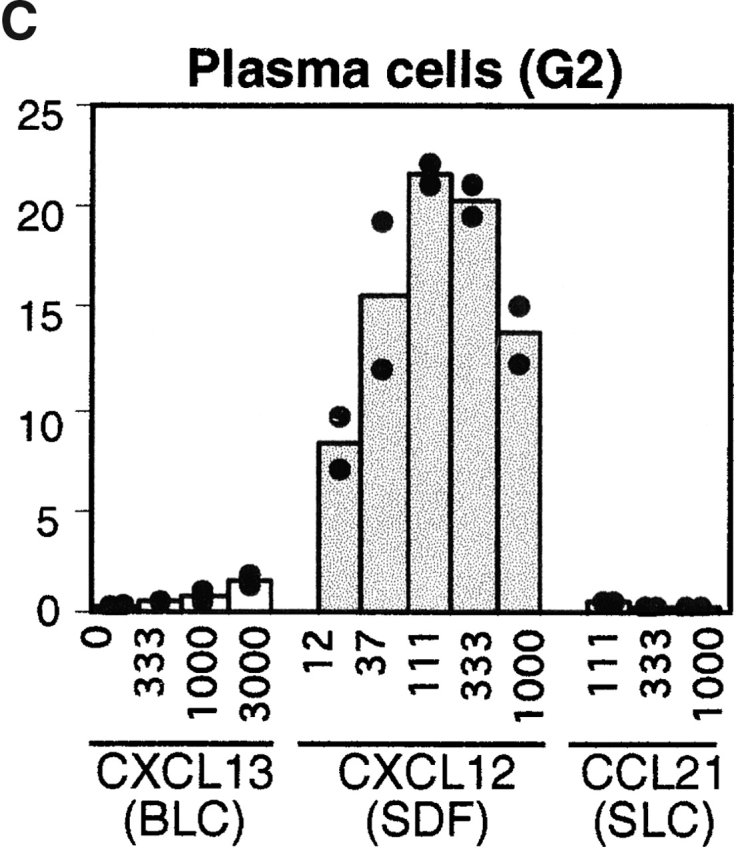
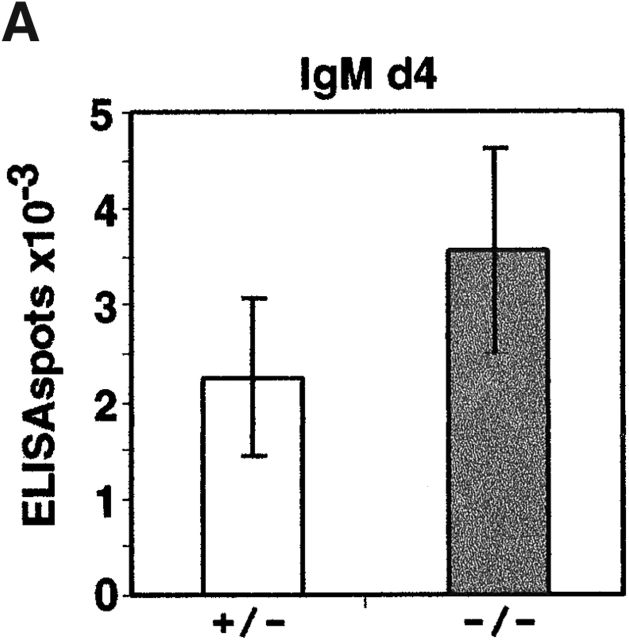
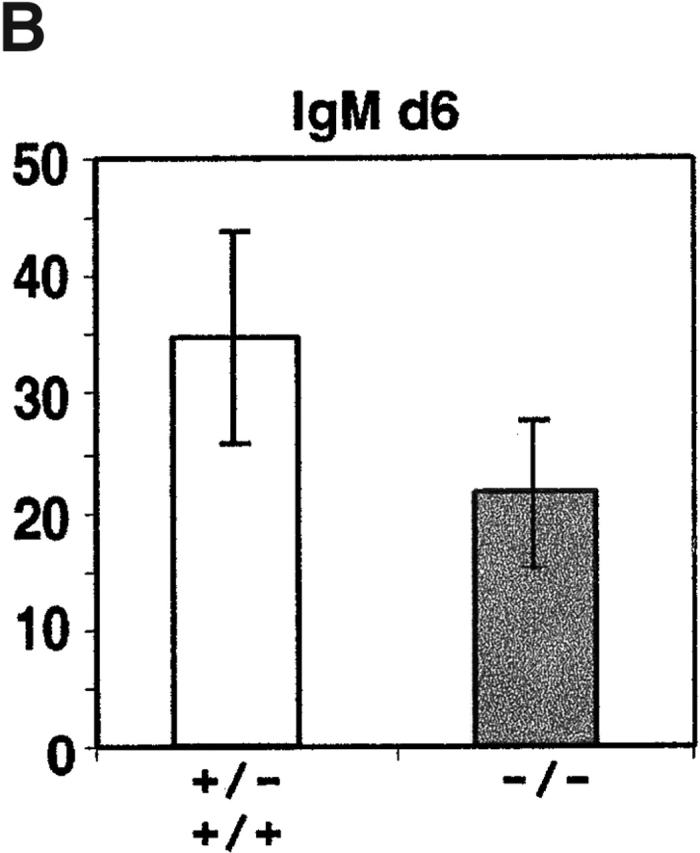
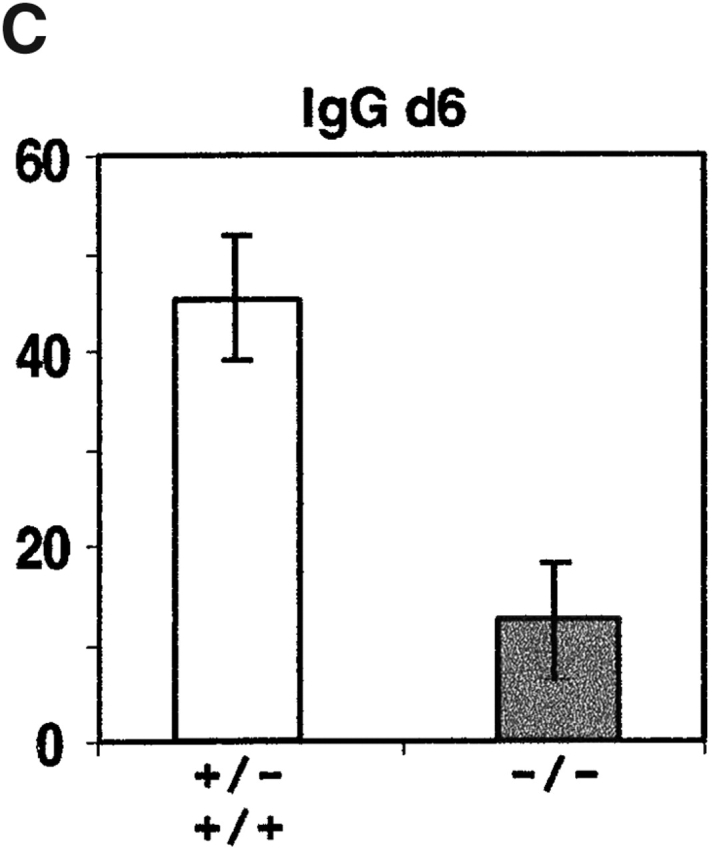
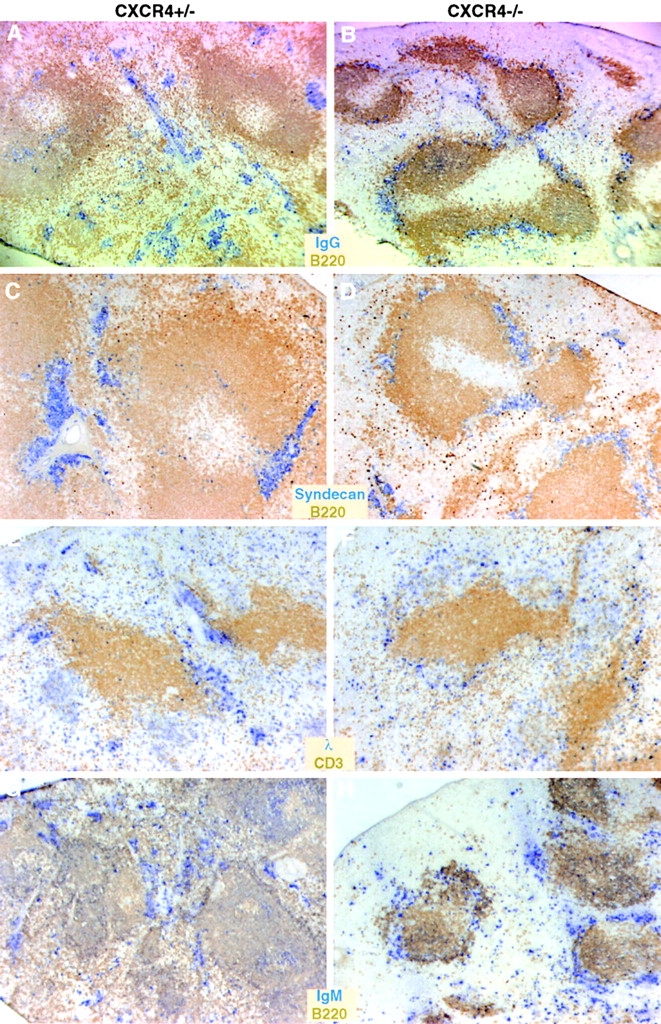
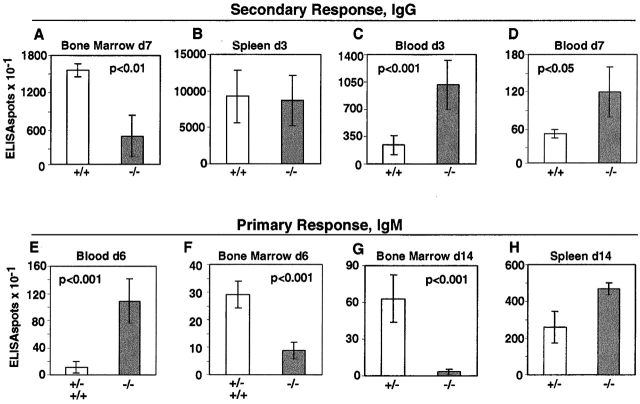
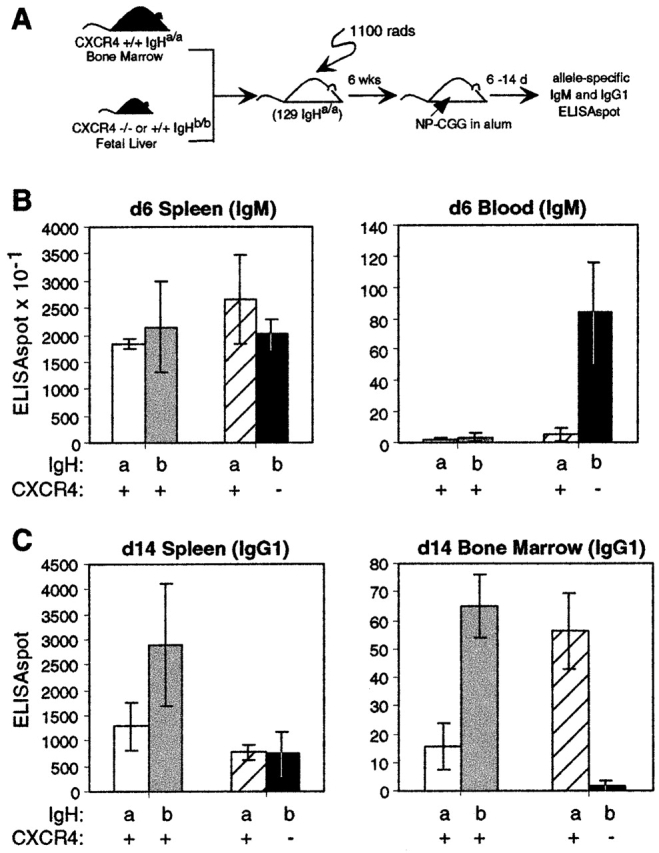
Antibody-secreting plasma cells are nonrecirculatory and lodge in splenic red pulp, lymph node medullary cords, and bone marrow. The factors that regulate plasma cell localization are poorly defined. Here we demonstrate that, compared with their B cell precursors, plasma cells exhibit increased chemotactic sensitivity to the CXCR4 ligand CXCL12. At the same time, they downregulate CXCR5 and CCR7 and have reduced responsiveness to the B and T zone chemokines CXCL13, CCL19, and CCL21. We demonstrate that CXCL12 is expressed within splenic red pulp and lymph node medullary cords as well as in bone marrow. In chimeric mice reconstituted with CXCR4-deficient fetal liver cells, plasma cells are mislocalized in the spleen, found in elevated numbers in blood, and fail to accumulate normally in the bone marrow. Our findings indicate that as B cells differentiate into plasma cells they undergo a coordinated change in chemokine responsiveness that regulates their movements in secondary lymphoid organs and promotes lodgment within the bone marrow.


Figures

Figure 1
Figure 1
Expression pattern of CXCL12 (SDF-1) in spleen and lymph node and codistribution of CXCL12-expressing cells and plasma cells. In situ hybridization analysis of CXCL12 in spleen (A and C) and lymph node (B and E) in combination with peanut agglutinin to detect germinal centers (A and B) or B220 to localize B cell areas (C and E). D and F are from sections nearby in the tissue to those in C and E, respectively, and are stained to detect B cells (IgD, blue) and plasma cells (syndecan, brown). Insets in A and B show detail of in situ hybridization signal. Arrows in C and D point to locations where CXCL12 and syndecan staining colocalize. F, follicle; GC, germinal center; MC, medullary cords; RP, red pulp; T, T zone. (A–F) Original magnifications: 5×. (Insets) Original magnifications: 20×.
Figure 2
Figure 2
Chemotactic response profiles of B cells and plasma cells to CXCL12, CXCL13 (BLC), and CCL21 (SLC). (A) Flow cytometric analysis of input cells and cells that migrated to the lower well of a trans-well chamber in the absence of chemokine (no chemokine) or in response to 1 μg/ml CXCL13 or 0.1 μg/ml CXCL12. (B and C) Summary of chemotaxis data in response to the indicated concentrations of chemokine, expressed as the percentage of transmigrated input cells. B cells and plasma cells were identified using gates G1 and G2 shown in A. Bars represent means of duplicate transwells. Assays were performed with spleen cells from mice 6 d after primary NP-CGG/alum immunization. Data are from one experiment that is representative of more than four experiments for each chemokine.
Figure 2
Figure 2
Chemotactic response profiles of B cells and plasma cells to CXCL12, CXCL13 (BLC), and CCL21 (SLC). (A) Flow cytometric analysis of input cells and cells that migrated to the lower well of a trans-well chamber in the absence of chemokine (no chemokine) or in response to 1 μg/ml CXCL13 or 0.1 μg/ml CXCL12. (B and C) Summary of chemotaxis data in response to the indicated concentrations of chemokine, expressed as the percentage of transmigrated input cells. B cells and plasma cells were identified using gates G1 and G2 shown in A. Bars represent means of duplicate transwells. Assays were performed with spleen cells from mice 6 d after primary NP-CGG/alum immunization. Data are from one experiment that is representative of more than four experiments for each chemokine.
Figure 3
Figure 3
Increased CXCL12 binding and decreased CXCR5 expression and CCL19 (ELC) binding by plasma cells compared with B cells. Spleen cells from mice immunized with NP-CGG/alum 6 d before were stained with B220, syndecan, and CXCL12-Fc (A–D), anti-CXCR5 (E), or CCL19–Fc (F and G), and analyzed by flow cytometry. B cells and plasma cells were identified as in the legend to Fig. 2 A. Controls in A, B, D, and F are plasma cells and in C and G are B cells, stained with LFA-3–Fc (A–D, F and G), or no primary antibody (E). In B and F, cells were preincubated with the indicated chemokine before addition of the Fc fusion protein. In C and D, cells were from irradiated mice that had been reconstituted for 6 wk with CXCR4+/− or CXCR4−/− fetal liver cells before immunization. In all other panels, cells were from immunized wild-type mice.
Figure 4
Figure 4
Antigen-specific IgM and IgG antibody-secreting cell numbers in spleen after primary immunization of CXCR4−/− and control (CXCR4+/− or CXCR4+/+) fetal liver chimeras. Chimeric mice were immunized intraperitoneally with NP-CGG in alum and 4 or 6 d later, spleen cells were isolated and antibody-secreting cell frequencies measured by anti–NP-ELISPOT assay. Bars represent mean number of ELISPOTs per spleen and error bars indicate 95% confidence intervals for data from groups of four mice at days 4 and 8 mice at day 6. No differences were observed between responses in +/− and +/+ animals. Average number of splenocytes per mouse: day 4, 9.4 × 10⁷ +/+, 4.3 × 10⁷ −/−; day 6, 1.1 × 10⁸ +/+ and +/−, 7.0 × 10⁷ −/−.
Figure 4
Figure 4
Antigen-specific IgM and IgG antibody-secreting cell numbers in spleen after primary immunization of CXCR4−/− and control (CXCR4+/− or CXCR4+/+) fetal liver chimeras. Chimeric mice were immunized intraperitoneally with NP-CGG in alum and 4 or 6 d later, spleen cells were isolated and antibody-secreting cell frequencies measured by anti–NP-ELISPOT assay. Bars represent mean number of ELISPOTs per spleen and error bars indicate 95% confidence intervals for data from groups of four mice at days 4 and 8 mice at day 6. No differences were observed between responses in +/− and +/+ animals. Average number of splenocytes per mouse: day 4, 9.4 × 10⁷ +/+, 4.3 × 10⁷ −/−; day 6, 1.1 × 10⁸ +/+ and +/−, 7.0 × 10⁷ −/−.
Figure 5
Figure 5
Altered plasma cell distribution in spleens of CXCR4−/− fetal liver chimeras. Spleen sections from CXCR4+/− or CXCR4−/− fetal liver chimeric mice immunized 6 d earlier with NP-CGG in alum (A–F) or with NP-Ficoll (G and H) were stained with the indicated antibodies (labels are the same color as the reaction product for that marker). Note that plasma cells contain large amounts of cytoplasmic antibody and stain strongly with the antibody-specific reagents (IgG, λ, or IgM, all in blue).
Figure 6
Figure 6
Reduced numbers of plasma cells in bone marrow and increased numbers in the blood of CXCR4−/− chimeras. (A–D) NP-specific IgG antibody-secreting cell frequencies in CXCR4−/− or control (CXCR4+/+) chimeras after secondary immunization with NP-CGG in alum. (E–H) NP-specific IgM antibody-secreting cell frequencies in CXCR4−/− or control (CXCR4+/+ or CXCR4+/−) chimeras after primary immunization with NP-CGG in alum. Tissues were isolated at the indicated time points after immunization and antibody-secreting cell frequencies determined by ELISPOT. IgM or IgG antibody-secreting cell frequencies per organ or per milliliter of blood were determined by NP-ELISPOT for four mice per group at days 3 and 7 of the secondary response, and four to seven mice per group at days 6 and 14 of the primary response. Average number of splenocytes per mouse: secondary day 3, 1.6 × 10⁸ +/+ and 1.3 × 10⁸/−; primary day 14, 8.9 × 10⁷ +/+ and 4.3 × 10⁷/−. Bone marrow cell numbers for each group differed by <30%.
Figure 7
Figure 7
Intrinsic CXCR4 requirement for plasma cell accumulation in bone marrow. (A) Mixed bone marrow and fetal liver chimeras were generated by mixing bone marrow for IgHa B6 mice with CXCR4−/− or CXCR4+/+ IgHb fetal liver cells and reconstituting irradiated 129 (IgHa) recipients. (B and C) After 6 wk, chimeric mice were immunized with NP-CGG in alum and IgMa and IgMb (B) or IgG1a and IgG1b (C) antibody-secreting cells were measured 6 or 14 d later in spleen, blood, or bone marrow as indicated. Data from animals reconstituted with wild-type IgHa bone marrow and CXCR4+/+ IgHb fetal liver are shown in white (IgHa) and gray (IgHb) bars; data from animals reconstituted with wild-type IgHa bone marrow and CXCR4−/− IgHb fetal liver are shown in striped (IgHa) and black (IgHb) bars. Numbers of antibody-secreting cells per organ or per milliliter of blood in each animal were measured as indicated. Total splenocyte numbers for each group of animals differed by <30%. Bars represent mean and error bars indicate 95% confidence intervals for groups of three mice.

References

    1. van Rooijen N., Claassen E., Eikelenboom P. Is there a single differentiation pathway for all antibody-forming cells in the spleen? Immunol. Today. 1986;7:193–196. - PubMed
    1. Jacob J., Kassir R., Kelsoe G. In situ studies of the primary immune response to (4-hydroxy-3-nitrophenyl)acetyl. I. The architecture and dynamics of responding cell populations. J. Exp. Med. 1991;173:1165–1175. - PMC - PubMed
    1. Liu Y.-J., Zhang J., Lane P.J.L., Chan E.Y.-T., MacLennan I.C.M. Sites of specific B cell activation in primary and secondary responses to T cell-dependent and T cell-independent antigens. Eur. J. Immunol. 1991;21:2951–2962. - PubMed
    1. Kosco M.H., Burton G.F., Kapasi Z.F., Szakal A.K., Tew J.G. Antibody-forming cell induction during an early phase of germinal centre development and its delay with aging. Immunology. 1989;68:312–318. - PMC - PubMed
    1. Luther S.A., Gulbranson-Judge A., Acha-Orbea H., MacLennan I.C. Viral superantigen drives extrafollicular and follicular B cell differentiation leading to virus-specific antibody production. J. Exp. Med. 1997;185:551–562. - PMC - PubMed

Publication types

MeSH terms