. 2001 Jul 15;21(14):5099-109.
doi: 10.1523/JNEUROSCI.21-14-05099.2001.

Genetic control of the mouse cerebellum: identification of quantitative trait loci modulating size and architecture

Affiliations

Genetic control of the mouse cerebellum: identification of quantitative trait loci modulating size and architecture

D C Airey et al. J Neurosci. .

Abstract

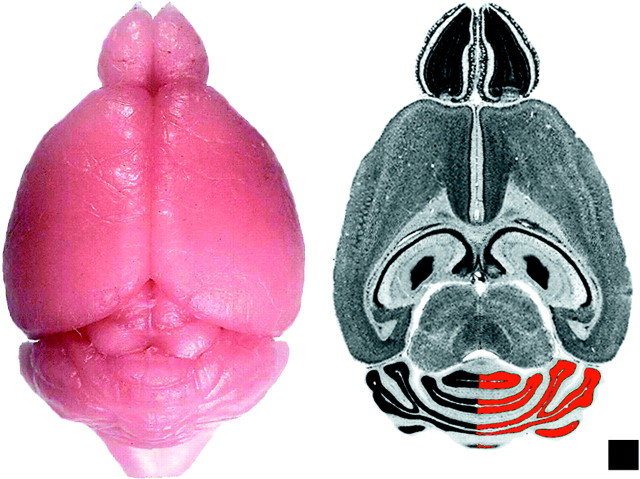
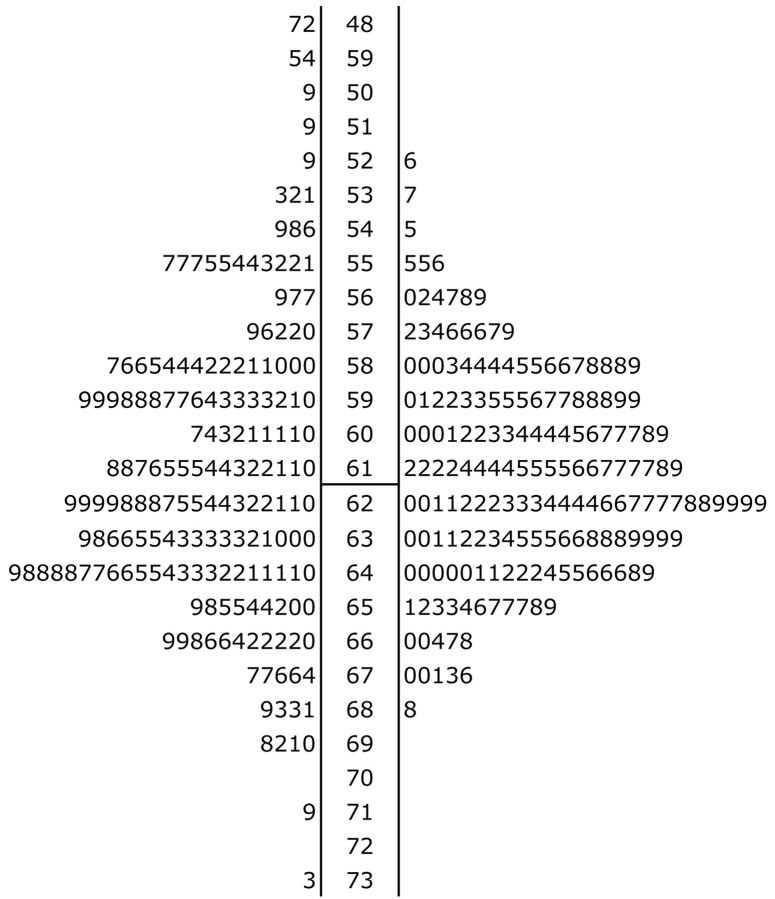
To discover genes influencing cerebellum development, we conducted a complex trait analysis of variation in the size of the adult mouse cerebellum. We analyzed two sets of recombinant inbred BXD strains and an F2 intercross of the common inbred strains, C57BL/6J and DBA/2J. We measured cerebellar size as the weight or volume of fixed or histologically processed tissue. Among BXD recombinant inbred strains, the cerebellum averages 52 mg (12.4% of the brain) and ranges 18 mg in size. In F2 mice, the cerebellum averages 62 mg (12.9% of the brain) and ranges approximately 20 mg in size. Five quantitative trait loci (QTLs) that significantly control variation in cerebellar size were mapped to chromosomes 1 (Cbs1a), 8 (Cbs8a), 14 (Cbs14a), and 19 (Cbs19a, Cbs19b). In combination, these QTLs can shift cerebellar size an appreciable 35% of the observed range. To assess regional genetic control of the cerebellum, we also measured the volume of the cell-rich, internal granule layer (IGL) in a set of BXD strains. The IGL ranges from 34 to 43% of total cerebellar volume. The QTL Cbs8a is significantly linked to variation in IGL volume and is suggestively linked to variation in the number of cerebellar folia. The QTLs we have discovered are among the first loci shown to modulate the size and architecture of the adult mouse cerebellum.


Figures

Fig. 1.
Fig. 1.
Dissecting the cerebellum. Left,Dorsal view of a fixed mouse brain. Right,Horizontal section from the Mouse Brain Library illustrating the method used to measure IGL volume. Half of the IGL is measured here for illustrative purposes only. Scale bar, 1 mm.
Fig. 2.
Fig. 2.
Distribution of cerebellar weights in the F2 intercross as illustrated by stem-and-leaf plots. Thevalues on the left are the observed values, and those on the right reflect correction by regression for brain weight. The mean for both distributions is marked by a horizontal line. From this graph, the distributions are illustrated, and the original data are presented. For example, the right distribution shows an overall normal curve, and that there are three cases with the adjusted cerebellar weights between 55 and 56 mg (55.5, 55.5, and 55.6 mg).
Fig. 3.
Fig. 3.
Interval mapping results for BXD and F2 mice. In each panel, the thicker black line indicates the likelihood ratio statistic at each chromosomal location (left y-axis). The thin black lineindicates the associated additive effect at each location (right y-axis). The x-axis for each panel is in centimorgans. A, Interval mapping of Chr 8 for adjusted cerebellar weight in BXD strains. B, Interval mapping of Chr 8 for adjusted cerebellar volume in BXD strains. C,Composite interval mapping of Chr 1 for adjusted cerebellar weight in BXD strains. D, Composite interval mapping of Chr 1 for adjusted cerebellar volume in BXD strains. E, Interval mapping of Chr 1 for adjusted cerebellar weight in F2 mice.F, Interval mapping of Chr 14 for adjusted cerebellar weight in F2 mice. G, Interval mapping of Chr 19 for adjusted cerebellar weight in F2 mice. H, Interval mapping of Chr 19 for adjusted cerebellar weight in BXD mice.
Fig. 4.
Fig. 4.
Dot plots for BXD cerebellar strain means at microsatellite markers D1Mit150 andD8Mit312, split by genotype. The y-axis has been standardized to present different phenotypes on the same scale and dots have been jittered horizontally for visibility. Adjusted cerebellar weight at D1Mit150(A) and D8Mit312(B). C, Combined effect from having D or B alleles at bothD1Mit150 and D8Mit312. D,Adjusted cerebellar volume at D8Mit312. Results for volume are similar to A and C for weight and are not shown. E, Adjusted IGL volume atD8Mit312. F Folia number atD8Mit312.

References

    1. Alder J, Lee KJ, Jessell TM, Hatten ME. Generation of cerebellar granule neurons in vivo by transplantation of BMP-treated neural progenitor cells. Nat Neurosci. 1999;2:535–540. - PubMed
    1. Barton RA, Harvey PH. Mosaic evolution of brain structure in mammals. Nature. 2000;405:1055–1058. - PubMed
    1. Butler W, Hodos AB. Comparative vertebrate neuroanatomy: evolution and adaptation. Wiley; New York: 1996.
    1. Churchill GA, Doerge RW. Empirical threshold values for quantitative trait mapping. Genetics. 1994;138:963–971. - PMC - PubMed
    1. Cooper PA, Benno RH, Hahn ME, Hewitt JK. Genetic analysis of cerebellar foliation patterns in mice (Mus musculus). Behav Genet. 1991;21:405–419. - PubMed

Publication types

MeSH terms

LinkOut - more resources